candle
two types of candles :- bullish and bearish like this picture

What is a candle stick in share market ?
Candle stick chart pattern: It is very important for a trader and investor to know the candlestick pattern because through it we can find out whether the market will be bullish, bearish or volatile in a range. We can find out this very easily from the candlestick pattern. For this it is very important for us to know candlestick patterns.
CANDLE STICK HISTORY ?
Candlestick originated in Japan in the 18th century. Japanese traders used candlestick in their business. Rice was used there to make candle sticks.
What is a candle in share market, how to read candlestick chart? (complete information)
To identify any candle stick, we should see its points like High, Low, Open, Close, body etc.
We can get Green red or Black and White candles in the trading chart.
If we see a green candle or white in the chart, it means that the market will be up or bullish. In simple language, the green candle indicates that the market is going up.
And if we see a red or black candle being formed on the chart then it means that the market will go to the bearish site or in simple language the market may fall.
How are candles formed on share market charts:-
Let us understand the above picture one by one, first we will understand the green candle and then the red candle. will understand
We try to understand the green candle according to the points mentioned in the picture:-
GREEN/RED CANDLE STICK :-
Open:- Open in green candle shows where a stock has opened.
- Close:- The close point shows where the stock has closed.
- High:- High point shows how much the stock had gone up and what was its highest score.
- Low:- Low point shows the minimum amount of stock that was there.
- Body:- We call the green area of the green candle as body. This body helps us to know which candle it is so that we can predict what the market will do.
On which time frame is it best to view trading charts ?
We may see different formations of candles in the chart on different time frames. It depends on us whether we are trading or investing. If we are trading then 5 minutes or 15 minutes time frame is right. And if we are investing, if we do swing trading then it is better to look at the chart for 1 hour or 1 day and if we buy stocks for long term then it is better to look at the chart for 1 day or weekly. It is considered correct to look at the time frame.
You can make the right forecast by using the right candles on the right time frame.
TYPES OF CANDLE
We can divide Candle List Candlestick Patterns into three parts –
1.Single Candle Stick Pattern
2.Double Candle Stick Pattern
3.Triple Candle Stick Pattern
Let us discuss these in detail: –
1.Single Candle Stick Pattern :-
As the name suggests, it contains a candle, which tells about the activities happening in the market.
By looking at a candle, we predict what may happen in the market, which is as follows: –
- 1.Doji
- 2.Hammer
- 3.hanging man
- 4.shooting star
- 5.spinning top candle
- 6.standard doji
- 7.gravestone doji
- 8.long legged doji
- 9.dragonfly doji
- 10.inverted hammer
- 11.spinnig top
All single candle stick full detail one by one click here :-https://smartstockadda.com/category/candle-stick-eg/single-candle-stick-pattern-eg/
2.DOUBLE CANDLE STICK PATTERN
It is clear from the name that Double candlestick pattern, we predict the events happening in the market by looking at two candles, due to which we can easily know what can happen next in the market, which makes it easier to understand the market in trading. are ,
These can be of the following types:-
- 1.Bullish Engulfing
- 2.Bearish Engulfing
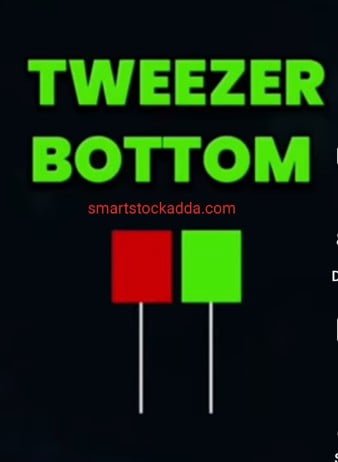
- 3.Tweezer Bottoms
- 4.Tweezer Tops
- 5.dark cloud
- 6.piercing line
- 7.bearish harami
- 8.bullish harami
- 9.bullish kicker
- 10.bearish kicker
all double candle stick pattern explained one by one click here :-https://smartstockadda.com/category/candle-stick-eg/double-candle-stick-candle-stick-eg/
3.TRIPLE CANDLESTICK PATTERNS
Triple Candle Stick Pattern
As is clear from the name Triple Candlestick Pattern, in this we look at three candles and predict what may happen next in the market. By using this well, we can further increase the profit in business.
Which can be as follows:-
- 1.Morning Star
- 2.Evening Star
- 3.Three White Soldiers
- 4.Three Black crows.
- 5.bullish abandoned baby
- 6.bearish abandoned baby
- 7.bullish three line strike
- 8.bearish three line strike
- 9.three outside up
- 10.three outside down
- 11.three inside up
- 12.three inside down
all triple candle stick pattern detail on this link :-https://smartstockadda.com/category/candle-stick-eg/triple-candle-pattern-eg/
Instagram click here
https://www.instagram.com/smartstockadda?igsh=NmloZHgyMTBzcnoz
YouTube channel click here
https://youtube.com/@smartstockadda1?si=wQIeoYfvTebfjCiY
Facebook page click here https://www.facebook.com/profile.php?id=61558073196066&mibextid=ZbWKwL

