What is Tweezer top candlestick pattern?
candle stick pattern series : https://smartstockadda.com/category/candle-stick/

The Tweezer top candlestick pattern is a bearish candlestick pattern that forms at the end of a market uptrend. This shows recession in the market. After its formation, It is believed that there may be a recession or decline in the market.
This is considered a tweezer-like candle pattern.
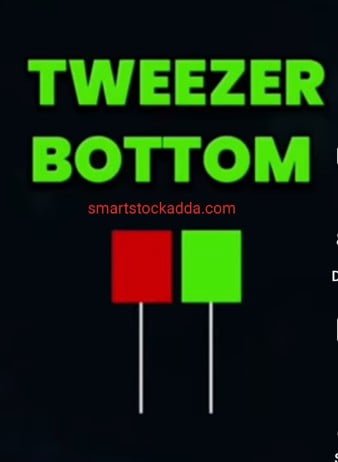
Because this is a double candlestick pattern, it consists of two candles, the first candle is red and the second candle is green. The highs of both are equal or may be slightly higher or lower.
Angle one demat open link : https://angel-one.onelink.me/Wjgr/9v76ufmo
How to identify the Tweezer top candlestick pattern?
Keep these main things in mind to recognize this candlestick pattern
- This candlestick pattern is formed during periods of sustained market uptrend.
- We see it at resistance during bullish times.
- In this, the color of the first candle is important, it should be green which indicates a bullish trend in the market.
- The second candle in this can be red or green.
- In the candlestick pattern, the high or highest price of the first and second candles is the same or may be slightly up or down.
- The first candle is Bullish and it can be any one of the bullish patterns like short body or long body but it indicates active buying.
- If the volume of the second candle is high , the chances of reversal are higher.
- Tweezer top candlestick pattern indicates the possibility of a bearish or down trade.
- If formed during an up trend, it indicates the possibility and indication of a reversal against the uptrend.
- Keep in mind that whatever be the candlestick pattern, we should use additional technical analysis tools such as indicators (RSI & MACD), volume etc.
How to trade with the Tweezer top candlestick pattern?

To understand how we should trade with the Tweezer top candlestick pattern, we will focus on three things: first, to know in detail how to enter the market with this candlestick pattern, where to place the stoploss and how to set the target. Let’s try :-
Instagram:- https://www.instagram.com/smart_stock_adda?igsh=MWk3Z2VoZGZhMDg3dg==
Tweezer top candlestick pattern When to enter the market?
After the Tweezer top candlestick pattern is formed, if the next candle formed after it is a bearish candle and its volume is high, then we need to time the candle when it breaks below the low of the second candle. It is correct to take entry in.
Tweezer top candlestick pattern Where should I place stoploss?
Stop loss time should always be set slightly above its high point so that even if it is retested, the chances of hitting the stop loss are greatly reduced.
What and where to set the target in Tweezer top candlestick pattern?
Since this candlestick pattern is formed at the resistance top, we should set the target after looking at the support or we should always set the target two or three times of our stop loss.
WhatsApp:– https://chat.whatsapp.com/BH4rxUvKCUQ7D7njjCwbHwhttps://chat.whatsapp.com/BH4rxUvKCUQ7D7njjCwbHw

