What is Tweezer bottom candlestick pattern?
Tweezer top candle stick pattern : https://smartstockadda.com/tweezer-top-candlestick-pattern/
Angle one demat open link : https://angel-one.onelink.me/Wjgr/9v76ufmo
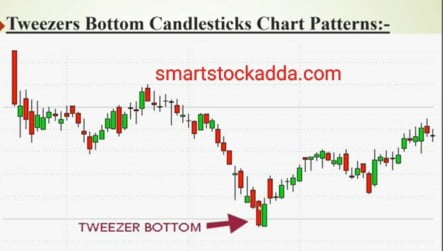
This is a bullish pattern. When there is a recession or decline in the market for a long time, it appears to be forming in support, which gives the message that the market may now be bullish.
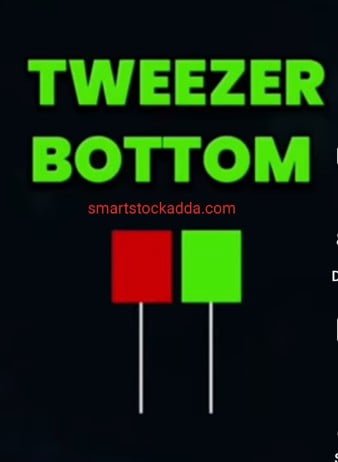
Because it is a double candlestick pattern, it consists of two candles, the first candle is red and the second candle is green, and the low prices of these two candles are almost the same or the same, that is a tweezer bottom candlestick pattern.

Instagram:- https://www.instagram.com/smart_stock_adda?igsh=MWk3Z2VoZGZhMDg3dg==
Down trend:-This candlestick pattern is formed after a market decline or a sustained bearish trend, which indicates that buyers are about to dominate the market and the market may now move towards an uptrend.
best mobile under 13k https://amzn.to/3Tm1HbA
Candles:-
Since this is a double candlestick pattern, it involves two candles:-
- The first candle in this is a bearish candle which is red in color, it tells us that the market will continue to fall.
- The second candle in this is a bullish candle, its color is green which shows that there is going to be a reversal in the market and there may be a rise in the market.
Price:- Keep in mind that the low price of both the first and second candles is the same or almost the same, let us try to understand this with an example.
Suppose a stock has been in recession for a long time, then after reaching the support, a bearish candle is formed whose low price is 100.
In such a situation, the next candle formed on the support of this stock can be a bullish candle, the partner’s point can be 100 or 99 or 101.
In such a situation, the low prices of these two candles become almost the same, then this is a message that this candlestick pattern has formed in the market and now there can be a reversal in the market.
Use of Tweezer bottom candlestick pattern in trading

To use it in trading we will emphasize on three aspects which are as follows:-
Entry:- Our first goal in any candlestick pattern is to know when to enter a stock or take entry for trading.
So in this candlestick pattern, when this candlestick pattern is formed, after the next candle opens above the high of the green bullish candle or after breaking its high, we call it the time of this candlestick pattern. It is right to take entry in this.
Stop loss (SL) :- It is very easy to set stop loss in this. In this, the low of the candlestick pattern is the low of both the candles is almost the same, so we should set the stop loss a little below the same low because the market can also retest. So it retests only till the low support and does not come below it, hence the chances of hitting our stoploss will be very less. Therefore, we should set a stop loss just below the low of this candle stick pattern.
Target:- Talking about target, we should set the target after seeing the resistance or we should set the target in two or three times of our stop loss.
WhatsApp:– https://chat.whatsapp.com/BH4rxUvKCUQ7D7njjCwbHwhttps://chat.whatsapp.com/BH4rxUvKCUQ7D7njjCwbHw

