THREE OUTSIDE DOWN
view of this candle stick pattern :-
What is the Three Outside Down Candlestick Pattern ?
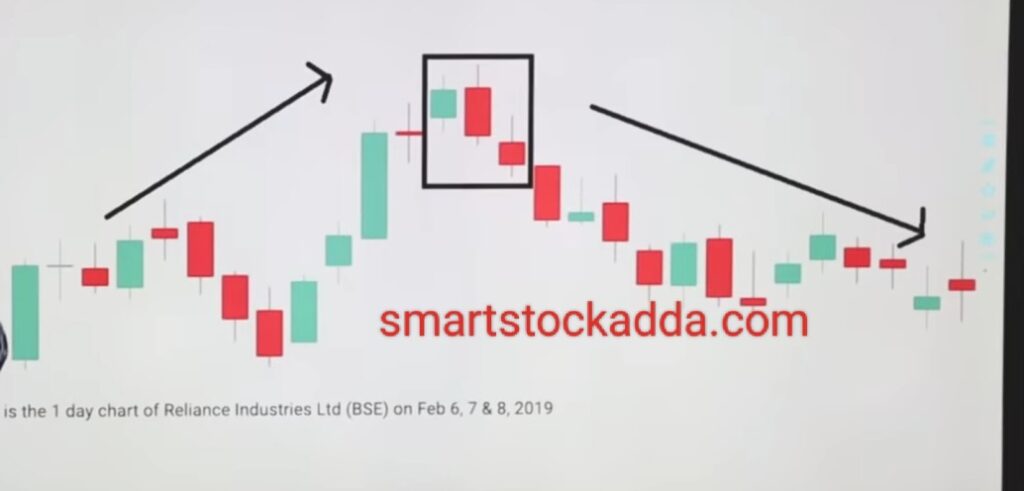
- The Three Outside Down candlestick pattern is a candlestick pattern indicating a downtrend that appears to form at the top of the chart.
- This is a bearish candlestick pattern.
- If this candlestick pattern is formed at the bottom or middle of the chart then it has no significance.
CANDLE FORMATION OF THREE OUTSIDE DOWN CANDLESTICK ?
- 1st:- The first candle will be a small bullish candle.
Color :- Green - 2nd:- The second candle will be a big bearish candle.
Which will open slightly above the first candle.
Its closing point will be below the low point of the first candle.
This will completely cover the first candle.
Colour:Red - 3rd:- The third candle will also be a bearish candle, which will open slightly below the middle part of the second candle and its closing point will be below the low point of the 2nd candle.
Color :- Red
Note: – Keep in mind that the first and second candles together form a bearish engulfing pattern.
Open demet account angle one click here : https://angel-one.onelink.me/Wjgr/9v76ufmo with 15rs/order brokreage charges top 100 users limited offer.
Use of Three Outside Down Candlestick Pattern in Trading?
It is quite easy to use the Three Outside Down candlestick pattern in trading. We can use it in trading by keeping the following things in mind: –
Entry into trading from Three outside down candlestick pattern?
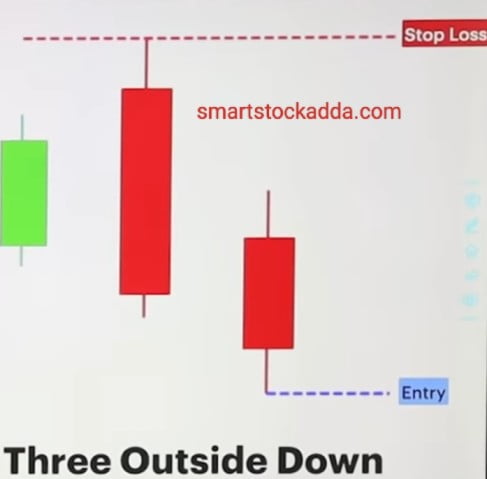
Entry in Three Outside Down Candlestick Pattern: When this candle stick pattern is formed at the top of the chart, then we have to enter the market through this candlestick pattern from the low of the third candle.
THREE OUTSIDE DOWN CANDLESTICK PATTERN in TRADING WHERE SHOULD I STOPLOSE?
It is quite easy to set a stop loss in the Three Outside Down Candlestick Pattern. We always have to set a stop loss at the high point of the second candle.
THREE OUTSIDE DOWN CANDLESTICK PATTERN in TRADING WHERE TO TARGET?
It is very easy to set a target in the Three Outside Down Candlestick pattern. We have to set a target that is two or three times our stoploss or we should set the target after seeing the support.
Identification and characteristics of three outside down candlesticks?
The Three Outside Down Candle Stick Pattern has the following identification and characteristics:-
:- This is a trend reversal pattern.
:- After the formation of three outside candle stick pattern, the market goes into downtrend.
:- Its first and second candles together form a Bearish engulfing pattern.
:- It is formed on resistance.
:- The colors of the candles in this candle stick pattern are respectively
1st – green
2nd – red
3rd – red
It happens .
:- The first candle is a small bearish candle.
:- The second candle is an extended bearish candle.
:- The third candle is a bearish candle which we call confirmation candle.
:- It is formed at the top of the chart during an uptrend.
:- The first candle indicates bullishness.
:- On the other hand, the third candle shows recession.
THREE OUTSIDE DOWN CANDLESTICK KE BANNE KE PICHE KI PSYCHOLOGY?
When the market keeps rising continuously, a bullish candle is formed at the resistance, which indicates that the bullish phase will continue in the market, but at this time a big bearish candle is formed at the resistance. From this we come to know that the buyers are becoming weak in the market. To confirm this, the next candle is formed as a bearish candle which gives us confirmation that now the buyers in the market have become weak and the sellers have become heavy.
In this situation the market is ready to trade down and there is a recession in the market.
Relationship between Three Outside Down Candlestick Pattern and Volume Indicators?
In the Three Outside Down Candlestick pattern, volume is more important because the volume of the first candle should be less than the second candle, that is, the volume of the second candle should be more than the first candle. And the volume of the third candle must be more than the previous two candles.
Along with this, we must use modern technical indicators like RSI & MACD for confirmation.
Instagram click here
https://www.instagram.com/smartstockadda?igsh=NmloZHgyMTBzcnoz
YouTube channel click here
https://youtube.com/@smartstockadda1?si=wQIeoYfvTebfjCiY
Facebook page click here https://www.facebook.com/profile.php?id=61558073196066&mibextid=ZbWKwL