All single candle stiicks pattern in full detailed : https://smartstockadda.com/category/candle-stick-eg/single-candle-stick-pattern-e
Definition of a Standard Doji
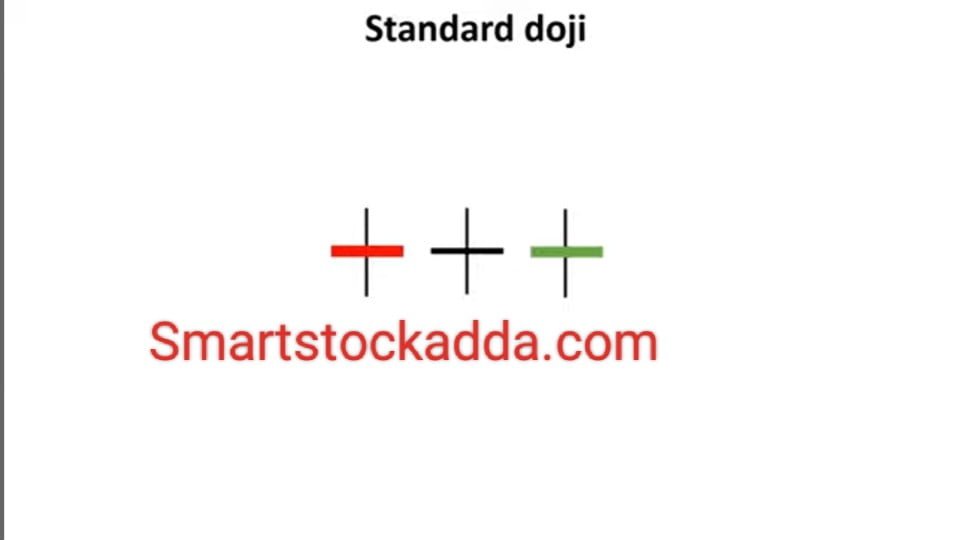
A standard doji candlestick is a pattern where the open and close prices are very close to each other, resulting in a small body or wick. The body of the candlestick is located between the upper and lower shadows, and its shadow is slightly shorter compared to a long-legged doji.
Angle one मैं demat account :- https://angel-one.onelink.me/Wjgr/9v76ufmo
Features of the standard Doji candle
In the standard Doji Candle pattern, its real body is located between the upper and lower shadows.
Its body is very small but small.
Color is not important in the standard Doji candle pattern.
If we try to understand the meaning of the standard Doji candle pattern, we find that the open and close points are very close.
In standard Doji candle pattern, from where the stock opens, buyers try to take it up but sellers again dominate and try to take it down by bringing it to the open price but again buyers become the Due to which it closes only after coming near the open price, forming a standard Doji candle pattern.
The shadow of the standard Doji candle pattern is slightly smaller than that of the long legged Doji candle.
The standard Doji candle indicates three types of signals:
- The market is becoming volatile.
- The market is now going up or experiencing bullish momentum.
- The market is now entering a bearish phase. Simply put, a market downturn is expected.
A standard Doji candle pattern indicates that neither buyers nor sellers were able to control the market in pushing it towards either bullish or bearish momentum.
Angle one मैं demat account :- https://angel-one.onelink.me/Wjgr/9v76ufmo
Use of STANDARD DOJI CANDLE STICK PATTERN in trading and investing ?
Standard Doji Candlestick Pattern
We can see it forming in three ways on the chart:
- Between support and resistance.
- Building on support.
- Forming at resistance.
What to do when the STANDARD DOJI CANDLE STICK PATTERN is formed in the middle of the chart?
When Standard Doji Candle Stick Pattern is formed in the middle of the chart, then trading and investing should be avoided in the market. Its indications are that the market will neither be bullish nor bearish and the market will remain at one place. Will keep moving within the range which will keep your premium price down
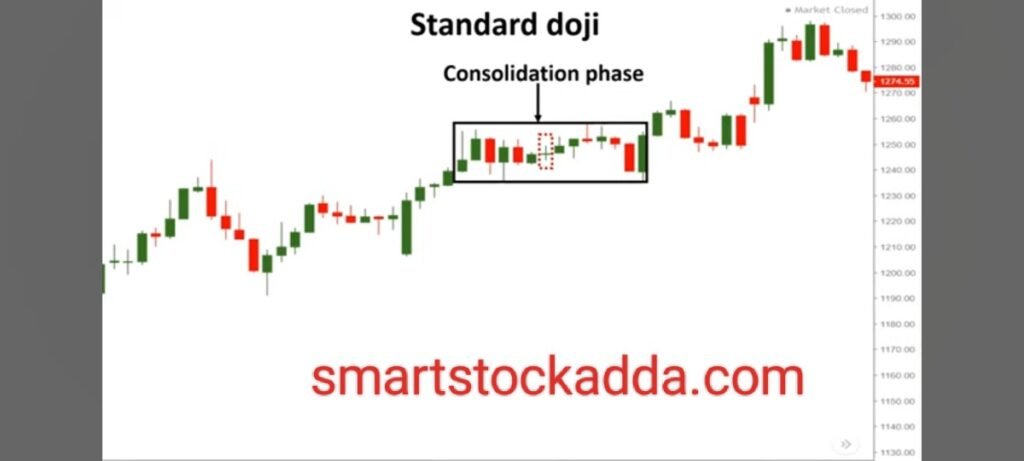
Its formation in the middle of the chart means that we can see volatility forming in the market. As shown in the picture, this is a chart pattern in which after the formation of a candle in the middle, the market started sustaining in this range.
We should neither trade with anyone nor invest money in it.
What to do if the Standard Doji Candlestick Pattern forms at support?
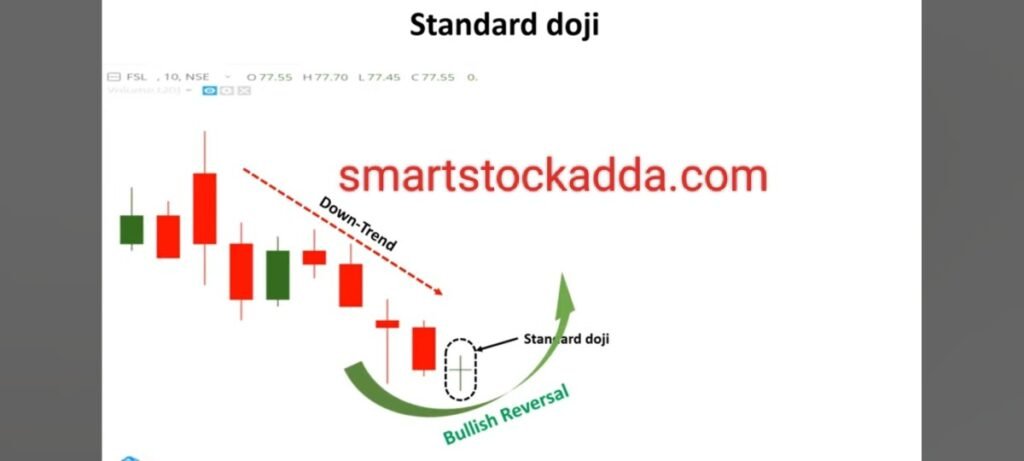
When the market has been experiencing a prolonged downtrend, meaning it keeps falling lower, and a Standard Doji candle is formed at the support level, it signals that a reversal in the market might be imminent. This indicates that the market is likely to turn around from the bearish trend and start moving upwards. This confirmation occurs when a Standard Doji candle forms at the support during a downtrend, followed by the closing of a candle above the high of the Standard Doji candle. This suggests that the market is ready to move upwards.
How to trade in bullish market and how to set entry, stop loss and target?
HOW TO ENTRY TARGET STOPLOSE IN STANDARD DOJI CANDLE
1.standard doji candle entry:-It is very easy to enter the bullish market as a standard doji candle is formed on the support and after that a bullish candle is formed, then we have to enter the market at the time of closing of the bullish candle. it occurs .
- After formation of standard Doji candle at the support, we have to place the always low price of the stoploss standard Doji candle stick.
3.Standard Doji Candlestick Pattern We should keep its target two to three times the stop loss or we should set the target after looking at the resistance.
What does it mean if STANDARD DOJI CANDLE STICK PATTERN is formed at resistance?
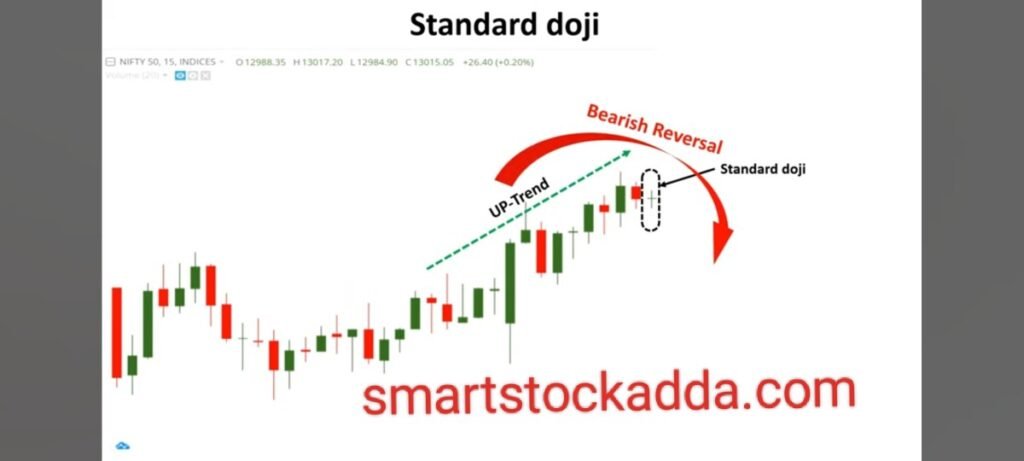
When the Standard Doji candlestick pattern forms after a prolonged uptrend or at resistance, it suggests a potential market reversal. If this candle forms at resistance, we should wait for confirmation from a bearish candlestick pattern, and if the closing is below the low of the Standard Doji candle, it confirms the possibility of a market downturn. It’s essential to also check the volume for confirmation.
How to trade in the bearish market with the standard doji candlestick pattern and where to set stop-loss and target?
- Entering the market in the standard doji candlestick pattern situation is often done by waiting for a bearish candle to form, and when the closing is below the low of the standard doji candle, that’s when I usually enter the market.
- Setting a stop-loss is quite easy in this scenario. It involves placing the stop-loss just above the high of the standard doji candle.
- In this situation, our target should be either two or three times our stop-loss, or we should set the target by looking at the support level. It’s advisable to aim for a 1:2 ratio target. 🎯
Instagram:- https://www.instagram.com/smart_stock_adda?igsh=MWk3Z2VoZGZhMDg3dg==
WhatsApp:– https://chat.whatsapp.com/BH4rxUvKCUQ7D7njjCwbHwhttps://chat.whatsapp.com/BH4rxUvKCUQ7D7njjCwbHw

