spinning top
spinning top on chart :-
What is SPINNING TOP CANDLESTICK ?
When the Spinning top candlestick pattern is formed on the market chart, it is difficult to predict which way the market will go.
This candle follows both bearish and bullish trends in the market.
If this candle is formed on resistance in the market, it means that the market is about to go into the market!
And if this candle is formed at the support, bottom of the market i.e. at the time of recession, then it indicates trend reversal from there i.e. the market is going to rise.
All single candle stick full detail one by one click here :-https://smartstockadda.com/category/candle-stick-eg/single-candle-stick-pattern-eg/
How to identify SPINNING TOP CANDLESTICK PATTERN !
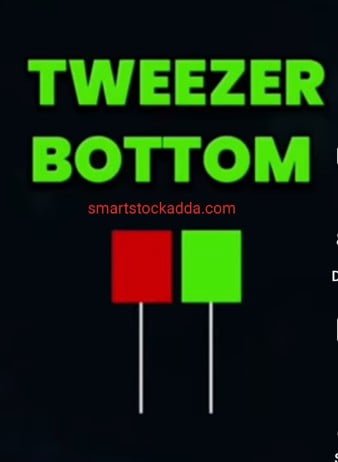
It is very easy to identify the Spinning top candlestick pattern because its body is short and its shadow is long. And the shadow it casts is two or three times bigger than its body.
Color is not important in this, it can be of any color from green to red.
Features and importance of SPINNING TOP CANDLESTICK PATTERN ?
- 1.After the formation of Spinning top candlestick pattern, it is difficult to predict which way the market will go.
- 2.Spinning top candlestick pattern: After the candle is formed, it is important to look at its volume. If the volume is high, it indicates a reversal in the market.
- If it forms resistance then it indicates a market.
- And if it forms on support then it gives a bullish signal and it is very important for us to look at the volume.
- This is a single candlestick pattern that indicates both bullishness and recession in the market.
- If we see this candle being formed in support, then it indicates to us that the market may now be bullish, whereas when this candle is formed during the recession, then there are signs of bullishness in the market.
- When this candlestick pattern is formed at resistance, it means that there may be a recession in the market, that is, when a candle is formed during a bullish period, there is a possibility of a reversal in the market.
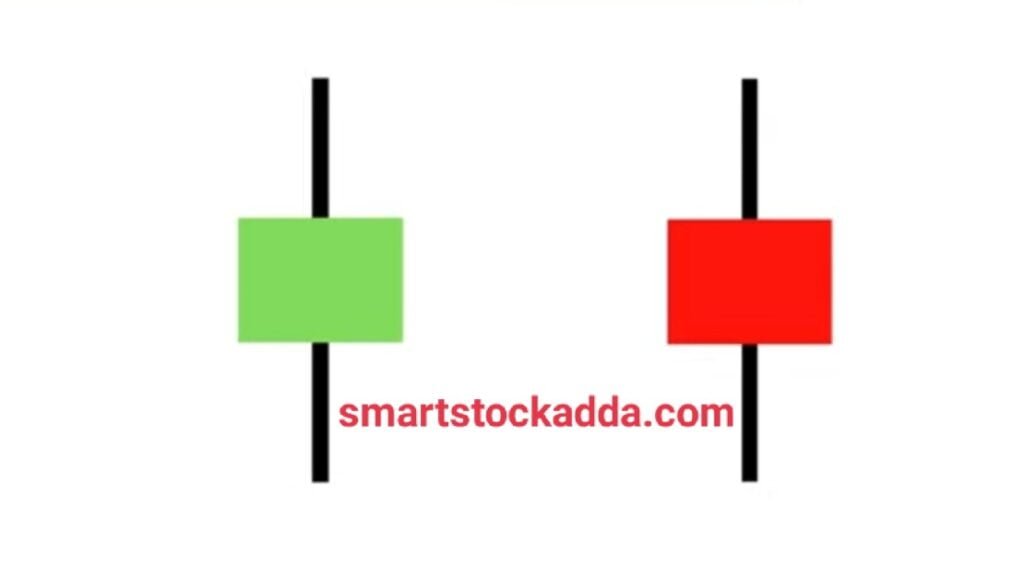
- Spinning top candlestick pattern: Color is not important, it can be of any color.
- Its body is small and its shadow or week is large, which can be two or three times the size of its body. Sometimes we may find it more than two to three times larger.
- To confirm the Spinning top candlestick pattern, one has to identify the candles formed after it.
- If this candle is formed in support then the candle formed after it should be a bullish candle and its closing should be above the Spinning Top candle or sometimes the candle formed after the Spinning Top candle. Can open above by giving gap If it is formed at resistance instead of support, then the next candle formed should be from a bearish candle stick pattern. In this case, we have to see the closing of the spinning top candle below the low or sometimes the same as support. In this the candle opens by leaving a gap at the bottom.
- Spinning top candlestick pattern can be of two types:
- 1. Bullish Spinning top candlestick pattern.
- 2.Bearish Spinning top candlestick pattern
- Its reliability is considered to be 50% in the market but we can increase it by identifying it with indicators and volume.
Open demet account angle one click here : https://angel-one.onelink.me/Wjgr/9v76ufmo with 15rs/order brokreage charges top 100 users limited offer.
Reason for formation of SPINNING TOP CANDLESTICK PATTERN ?
This candle is formed when both buyers and sellers in the market try to move the market into recession and bullishness.
Let us try to understand this with an example :- Suppose a stock opened, the sellers tried to bring it down by putting pressure on it from its opening price, but then the buyers came there to dominate and tried to take it up, and again the sellers tried to bring it down. Tried and it closes near the open point, then in this situation a spinning top candle pattern is formed.
What color is the SPINNING TOP CANDLESTICK PATTERN?
In Spinning top candlestick pattern, any color is not important, it can be red or green.
What is the realiability of SPINNING TOP CANDLESTICK PATTERN in the market?
Talking about the reality of Spinning Top Candlestick Pattern, it is considered to be 50% but we can increase it with the help of indicators and volume.
Relationship between SPINNING TOP CANDLESTICK PATTERN and VOLUME
The relationship between these two is very important because if we want to predict the full possibility of a reversal in the market, then we have to look at the formation of spinning top candles as well as its volume. If its volume is high then only the possibility of a reversal in the market is expressed. That is why there is a strong relationship between these two.
Types of SPINNING TOP CANDLESTICK PATTERN
There are two types of spinning top candlestick patterns :-
1.Bullish spinning top candlestick pattern
2.bearish Spinning top candlestick pattern
BULLISH SPINNING TOP CANDLESTICK PATTERN

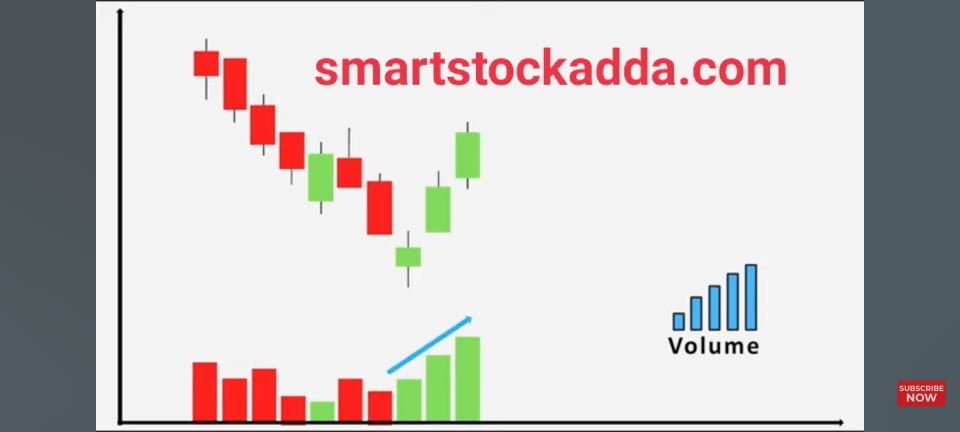
In the bullish spinning top candlestick pattern, the spinning top candle is seen forming at the support during the recession, which gives us an indication that a reversal is about to happen in the market and the market may now go into a bullish trend.
BEARISH SPINNING TOP CANDLESTICK PATTERN
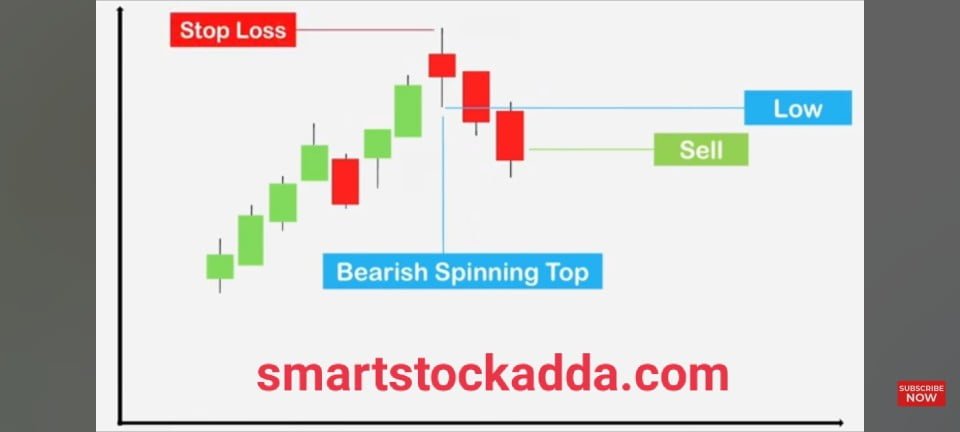
In this type of candle pattern, the spinning top candle is formed at the resistance which indicates to us that the market may now go into recession and there is a strong possibility of a reversal in the market.
Use of SPINNING TOP CANDLESTICK PATTERN in trading
Whether you are doing option trading or investing, you can earn good profits by using this candlestick pattern. For this, we should have complete knowledge about this candle pattern.
To earn better profit, we will tell you in detail about entry stoploss and target.
Where to get entry in SPINNING TOP CANDLESTICK PATTERN?
bullish spnning top :-
It is very easy to take entry in it, if it is formed on support then it gives us a bullish signal. After the formation of spinning top candle on support, we have to wait for the formation of next bullish candle. After its confirmation, we have to enter the market.
Along with this, it is very important to look at the volume also. Keep in mind that the next candle formed after the spinning top candle should also have a higher volume and its closing point should be above the high of the spinning top candle.
After this we can enter the market
bearish spinning top :-
If this candle forms resistance then it gives us a bearish signal.
If the Spinning Top candle is seen forming at the resistance then we have to wait for the formation of a bearish candle and the closing point of the bearish candle that is formed should be below the low of the Spinning Top candle. Needed After this we can enter the market.
Where to place stop loss in SPINNING TOP CANDLESTICK PATTERN ?
It is very easy to place stoploss in Spinning Top Candlestick Pattern. For this we have two scenarios or events.
1.support :- When this candle is formed in support then I have to set stoploss on its two prices.
2.resistance:- When the spinning top candle is seen forming at the resistance then we have to put stoploss on its high point.
SPINNING TOP CANDLESTICK PATTERN Where should I target ?
When it forms on support, we set a target after seeing its resistance or we have to set a target two or three times the stop loss.
When the spinning top candle is formed at resistance, then we have to set targets after looking at the support or we have to set targets by exceeding the stop loss by two or three times.
Instagram click here
https://www.instagram.com/smartstockadda?igsh=NmloZHgyMTBzcnoz
YouTube channel click here
https://youtube.com/@smartstockadda1?si=wQIeoYfvTebfjCiY
Facebook page click here https://www.facebook.com/profile.php?id=61558073196066&mibextid=ZbWKwL