All single candlestick pattern

hammer candle

this is up-trend candle stick pattern , its make on support when market bearish after making this candle market goes to up-trend .
Identifying a hammer candle is quite easy because it looks like a hammer.In a hammer candle, the body is small, and its shadow, or wick, is large. As depicted in the image. In a hammer candle, the shadow of the hammer is two (2×) or three times (3×) larger than its body. A candle is considered a hammer candle only when its shadow is two or three times larger than its body; otherwise, it is not considered a hammer candle.
Hammer Candlestick Pattern – When there is a decline in a stock in the market, this pattern forms at the lower levels of the chart and indicates that a trade reversal is likely to occur from here, and the market will now move upwards.
Open demet account angle one click here : https://angel-one.onelink.me/Wjgr/9v76ufmo with 15rs/order brokreage charges top 100 users limited offter
HANGING MAN
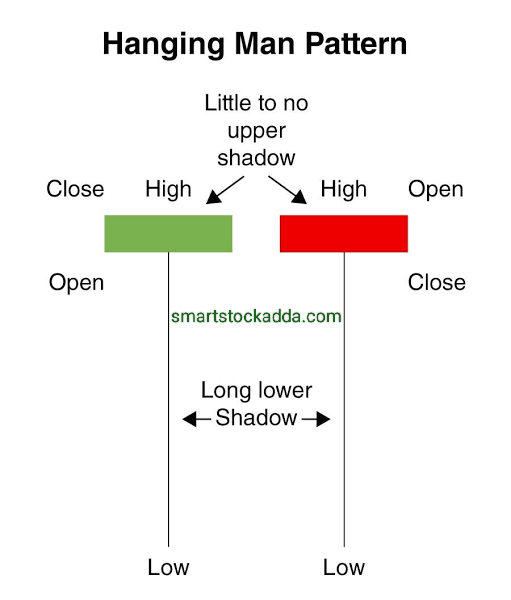
this is downtrend candle stick pattern , its make on resistence when market bullish after making this candle market goes to downtrend .
As the Hanging Man pattern is shown in the picture, a small body is found in the Hanging Man and its shadow should be two or three times larger than its body, only then it is considered a Hanging Man candle. This type of candle will appear on the chart when the market is bullish. When this candle is formed, for its confirmation, we look at the candle made from a bearish candlestick pattern and find out that it is from here. Now the market trend is going to change and the market is going to show recession and the market will fall down.
Instagram click here
https://www.instagram.com/smartstockadda?igsh=NmloZHgyMTBzcnoz
SPINNING TOP
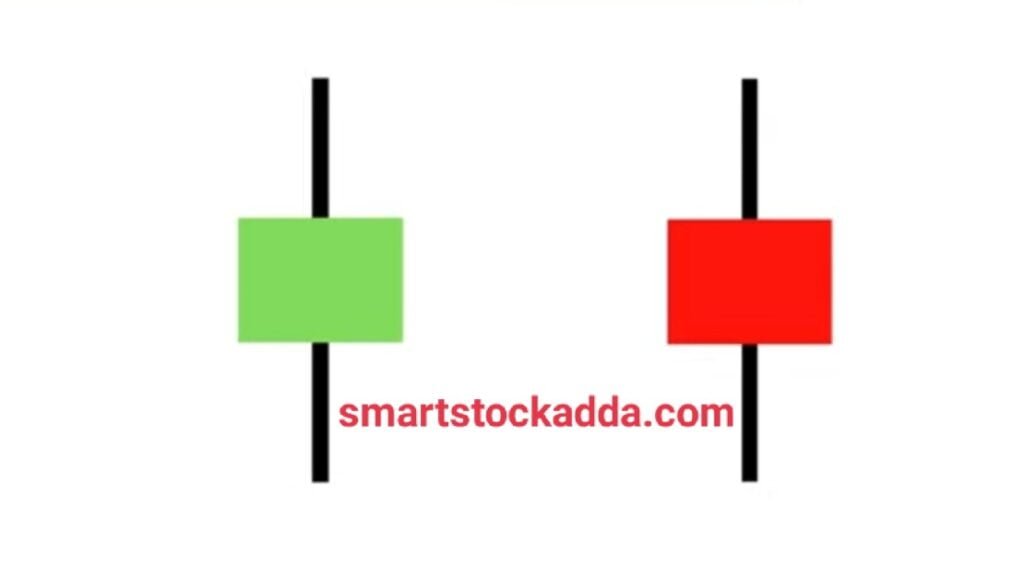
When the Spinning Top Candlestick Pattern is formed on the market chart, it is difficult to predict which way the market will go.This candle follows both bearish and bullish trends in the market.
If this candle is formed on resistance in the market, it means that the market is about to go into the market!
And if this candle is formed at the support, bottom of the market i.e. at the time of recession, then it indicates trend reversal from there i.e. the market is going to rise.
It is very easy to identify the Spinning top candlestick pattern because its body is short and its shadow is long. And the shadow it casts is two or three times bigger than its body.
Color is not important in this, it can be of any color from green to red.
SHOOTING STAR
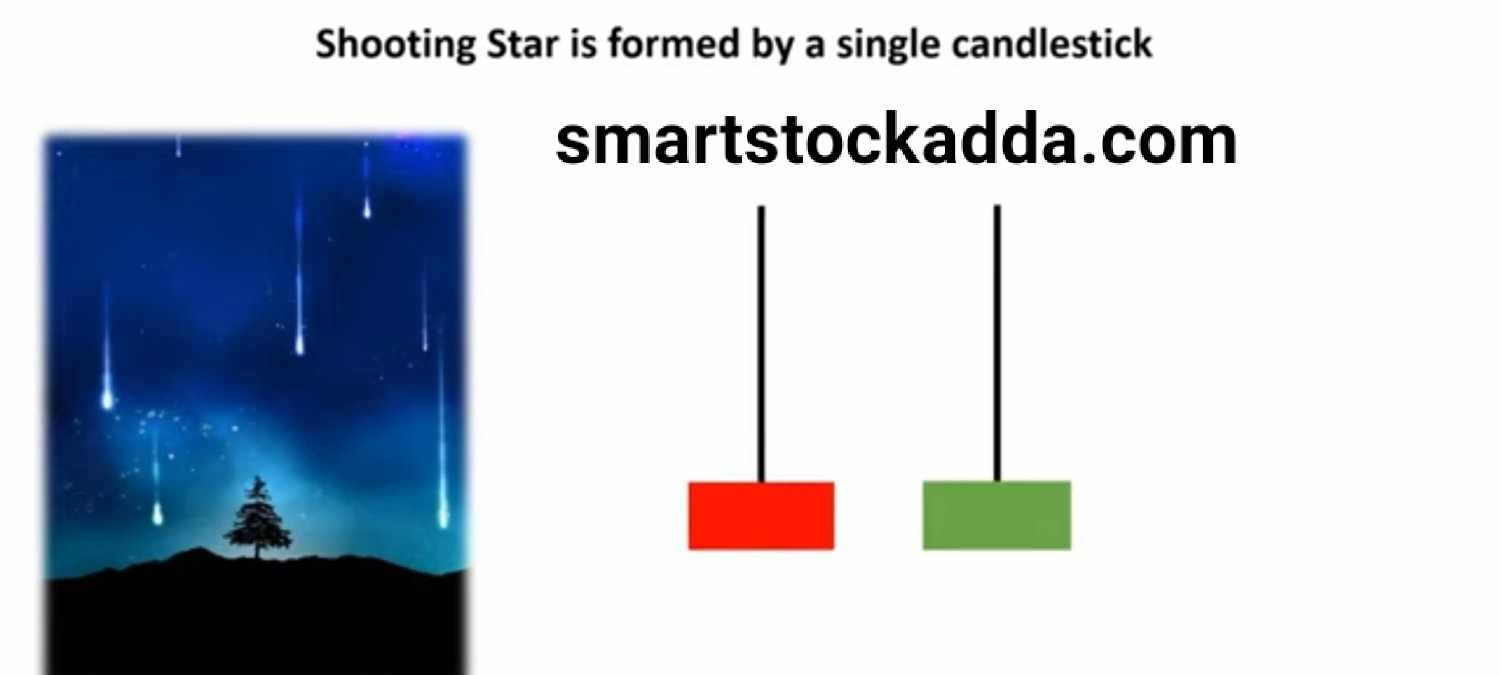
Shooting star candle is very easy to identify.
Such a candle in which the body is small and its shadow is two or three times larger than its body or sometimes it is more than two or three times larger, we will call such a candle a shooting star candle. Its body is possessed by Lo.
And it has a shadow on its upper side i.e. on the open side. A shooting star is similar to an inverted hammer. This shows recession in the market. If we see this on the chart, it means that there may be a recession in the market.
We always see it forming at the top of the bullish market trend.
Open demet account angle one click here : https://angel-one.onelink.me/Wjgr/9v76ufmo with 15rs/order brokreage charges top 100 users limited offter
DOJI CANDLE STICK PATTERN

Doji candlestick pattern is considered a reliable pattern in the market. In Doji candlestick pattern, the opening and close price is the same, that is, there is no body in the candle.
This explains these decisions in the market. This means that both buyers and sellers are confused about where the market will go, whether the market will go up or down.
If a candle in a pattern has a body, it is not counted as a doji.
There are four types of Doji candle stick patterns
- Standard Doji.
- Gravestone Doji
- Long-legged.
- DRAGONFLY
YouTube channel click here
https://youtube.com/@smartstockadda1?si=wQIeoYfvTebfjCiY
STANDARD DOJI
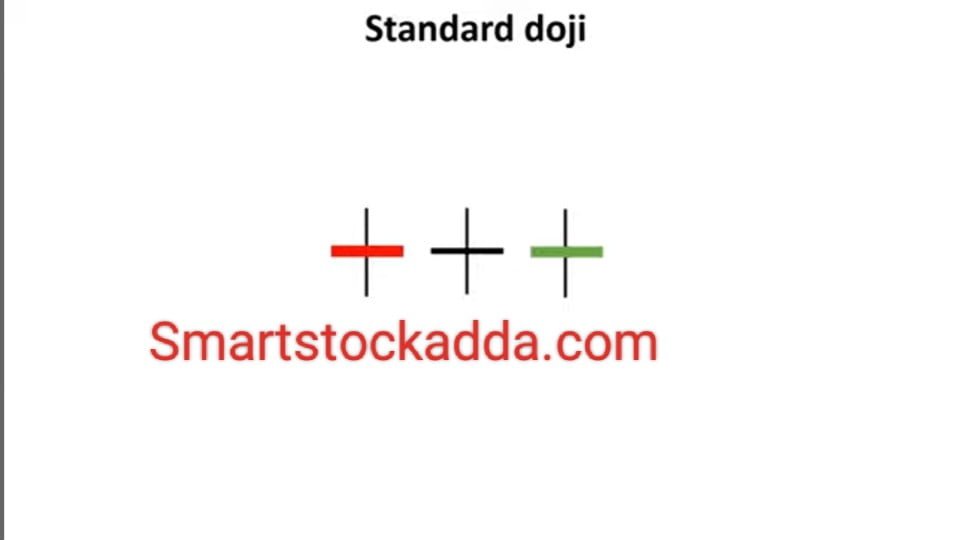
Standard Doji candle is a candlestick pattern in which the open and close prices are very close, due to which it has a small body. Its body is in the middle of the upper and lower shadows and its shadow is slightly shorter than the long legged doji. It is less. In the standard Doji Candle pattern, its real body is located between the upper and lower shadows.
Its body is very small but small.
Color is not important in the standard Doji candle pattern. Standard Doji candle gives three types of signals: 1. The market is going to be volatile. 2.The market is now going to go up or go up. 3.The market is now going to enter a recession phase. In simple words, the market is going to decline now.
Open demet account angle one click here : https://angel-one.onelink.me/Wjgr/9v76ufmo with 15rs/order brokreage charges top 100 users limited offter
GRAVESTONE DOJI
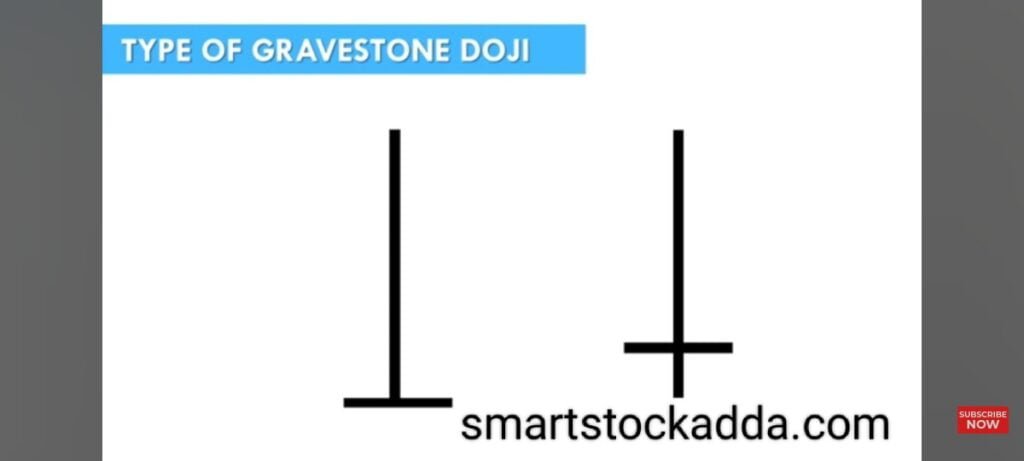
The Gravestone candle indicates to us that there may be a reversal in the market. When the market is in an up trend and after that a Gravestone Doji candle is formed, then from there the market can now go into recession or follow a down trend.
In Gravestone Doji, the low close and open points are very close and its shadow should be two to three times larger than its body at the top.
Such a Doji candle in which from where the stock opened, buyers take its price up, then sellers bring its price down to where it opened, and then it closes where it opened. This type of Doji candle is called a gravestone doji candle.
Facebook page click here https://www.facebook.com/profile.php?id=61558073196066&mibextid=ZbWKwL
LONG LEGGED DOJI
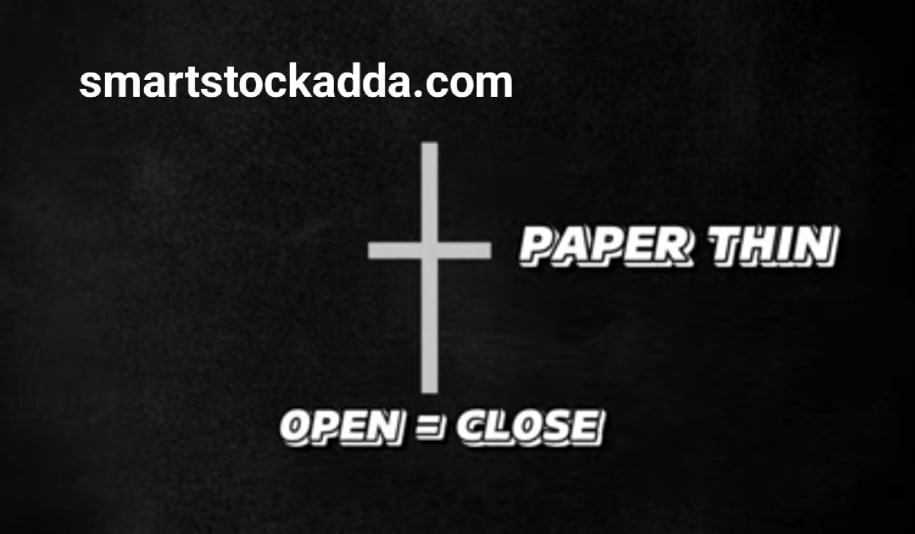
Suppose a stock opened and went up, then went down after reaching the open point and then closed near the open point, then we will call the candle formed as a long legged candle pattern.
As you have described the picture of the long-legged Doji.
Recognizing the Long Legged Doji Pattern
In this, the body of the candle is found in the middle and the upper and outer shadow is considered very big.
In this the actual body is small with the opening and closing points being very close.
The shadow it casts is longer and longer.
From this you can recognize that this is a long legged candle pattern.
DRAGONFLY DOJI
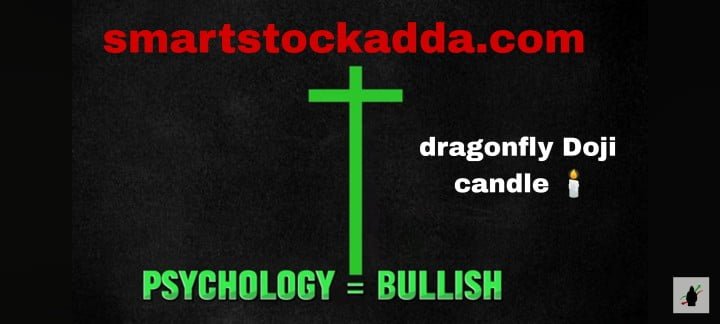
Dragonfly Doji candle is a candle in which its candle body is near the high point and its long shadow is near the low point. And also, the distance between its open and closing points is very close, which makes its body small. In Dragonfly Doji candles, the open high and closing points are very close.
- Dragonfly Doji candles represent market reversals or a bullish candlestick pattern.
- Dragonfly Doji candles have a long lower shadow and no or very short upper shadow.
- Dragonfly Doji candles have a small size with open highs and close points very close.
- In this, there is a long shadow downwards which is 2 to 3 times larger than its actual body. Color is not important in the Dragonfly Doji candle.
- Dragonfly Doji candles appear to form at support during bearish or bearish market trends.
- This is considered to be the opposite or reverse of the Gravestone Doji candle. It is of the same type, the only difference is that it indicates bullishness and the Gravestone candle indicates bearishness.
- Its name itself makes it clear that the fly in the dragon fly candle is showing us a bullish change in the market.
Instagram click here
https://www.instagram.com/smartstockadda?igsh=NmloZHgyMTBzcnoz
YouTube channel click here
https://youtube.com/@smartstockadda1?si=wQIeoYfvTebfjCiY
Facebook page click here https://www.facebook.com/profile.php?id=61558073196066&mibextid=ZbWKwL
