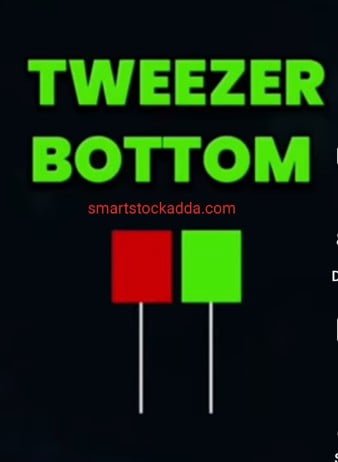
WHAT IS A HANGING MAN PATTERN
Hanging Man: Identifying good traders means understanding candlestick patterns,
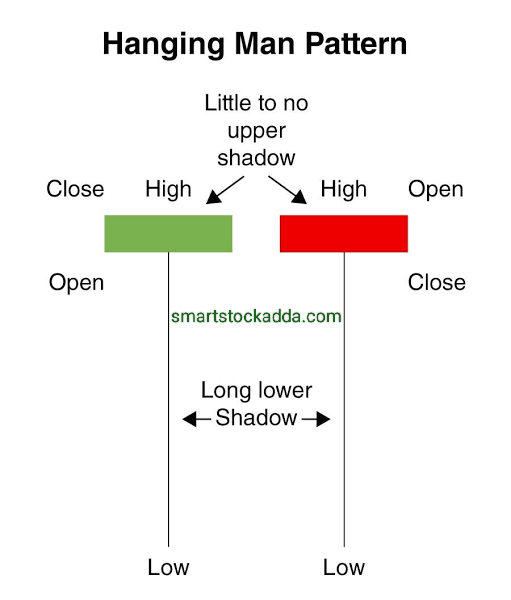
Among which the Hanging Man candlestick pattern holds significance. A candle whose body is positioned upwards and whose shadow or wick is two or three times the size of the body is termed a Hanging Man. It resembles a hammer candle, with the only difference being that the hammer forms at the bottom of the chart, indicating a bullish trend, while the Hanging Man forms at the top of the chart, suggesting a potential reversal in the market trend, i.e., a bearish signal. The Hanging Man candlestick pattern is considered a reliable indicator. By observing it, we can anticipate a possible change in the market trend, indicating a potential downturn. It’s essential to note that the Hanging Man may have a small upper shadow or wick, and its color could be green, red, white, or black.
Angle one मैं demat account :- https://angel-one.onelink.me/Wjgr/9v76ufmo
How to Identify a Hanging Man Candle

As shown in the image, a Hanging Man pattern features a small body with a shadow or wick that is two or three times larger than the body, indicating a Hanging Man candle. When the market is showing bullish momentum and a Hanging Man candle forms at the top of the chart, it suggests that sellers are becoming dominant, and buyers are weakening. When we see a Hanging Man candle in a bullish trend, it often signals a potential reversal in the market, indicating a likely downtrend.
double candle stick pattern full series with pdf in hindi visit here : https://smartstockadda.com/category/double-candle-stick/
Trading with the Hanging Man Candlestick Pattern

When the market is in a bullish trend and a Hanging Man candle forms at the top of the chart, it indicates that sellers are becoming dominant, and buyers are weakening. Confirming this pattern, we should also look at support and resistance levels. If a Hanging Man candle forms at resistance, there’s a high probability of a market reversal downwards. After a Hanging Man forms at resistance, we need to observe if the next candlestick pattern is bearish; if it is, it signals that the market is likely to decline further.
Setting Stop Loss and Target with the Hanging Man Candlestick Pattern
Since the Hanging Man candle forms at the top of the chart, we should set our stop loss at its high and target should be three or four times higher than the stop loss, or we can look at support levels to set our target.
Instagram:- https://www.instagram.com/smart_stock_adda?igsh=MWk3Z2VoZGZhMDg3dg==
WhatsApp:– https://chat.whatsapp.com/BH4rxUvKCUQ7D7njjCwbHwhttps://chat.whatsapp.com/BH4rxUvKCUQ7D7njjCwbHw

