BULLISH ABANDONED BABY
BULLISH ABANDONED BABY ON CHART :-
What is the Bullish Abandoned Baby Candlestick Pattern ?
The Bullish Abandoned Baby candlestick pattern is a triple candlestick pattern indicating bullishness in the market. Which indicates a reversal in the market, it is built on support.
It consists of three candles.
Bullish abandoned baby In Abandoned means rejection. That means abandoned baby would mean a rejected child.
bearish abandoned candle stick pattern :- https://smartstockadda.com/bearish-abandoned-baby-candlestick-p/
How to identify the Bullish Abandoned Baby candlestick pattern ?
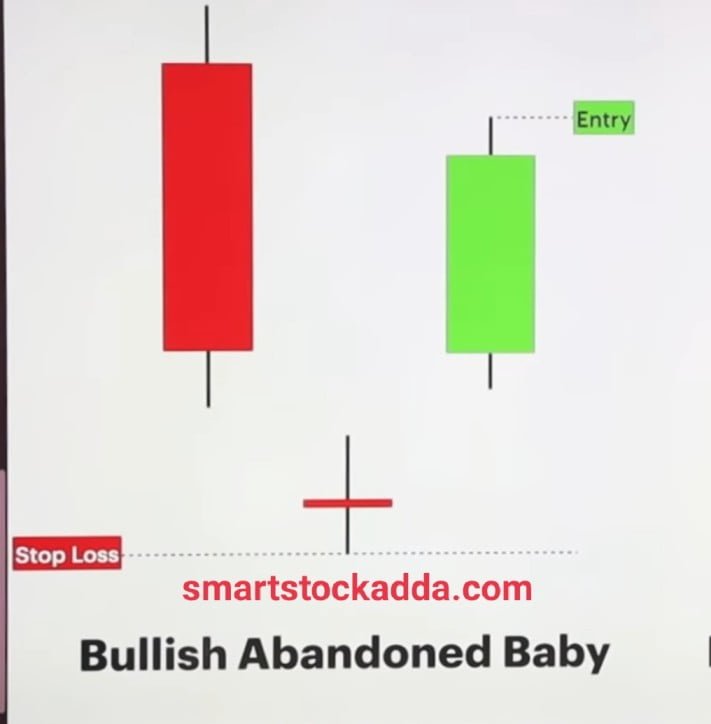
If there is a Triple candle stick pattern, then we have to see the formation of three candles in it. In this, the three candles will be like this, through which you will be able to recognize that a candlestick pattern is visible forming on the chart –
- First / first candle :- The first candle in this will be a big bearish candle. Which will look like a Maruboju candle.
- Second candle:- The second candle should be gap down open from the first candle, it will be a Doji candle in which color is not important.
- Third Candle:- This will be a long bullish candle which will give a possible signal of reversal in the market and will indicate that the market is going to rise.
Features of Bullish Abandoned Baby Candlestick Pattern ?
The characteristics of the Bullish Abandoned Baby candlestick pattern are as follows: –
- This is a bullish candlestick pattern which indicates a bullish trend in the market. After the formation of this pattern, there is a strong possibility of a bullish rise in the market.
- In this candlestick pattern, the first candle is a big bearish candle which indicates a recession in the market.
- The third candle in this is an extended bullish candle which expresses the possibility of trend reversal in the market.
- This triple candlestick pattern appears to be forming at support after a long-running bearish trend.
- When this candlestick pattern is formed, then we should use modern technology of indicators (RSI & MACD) for confirmation of the bullish trend in the market.
- It is similar to the Morning Star candlestick pattern, the only difference between the two is that the second candle in it is gap down open.
- In this candlestick pattern, the volume should also be checked. In this pattern, the volume of the third candle should be higher and if the volume of all the candles formed after that is higher then it will be considered as a more powerful reversal.
The most important thing in this pattern is that the second candle formed after the first candle should open the gap below the first candle, only then this candle stick pattern is formed.
all triple candle stick pattern pdf :-https://smartstockadda.com/category/candle-stick-eg/triple-candle-pattern-eg/
Reason for formation of Bullish Abandoned Baby candlestick pattern ?
Reason for formation of Bullish Abandoned Baby candlestick pattern
If a particular stock is in recession for a long time and falls to its lowest limit, then in that situation this triple candlestick pattern is formed after going to the support.
In order to increase the reversal of particular stocks in the market, positive news or news is leaked in the market by brokerage form,
Due to which the buyers of this particle stock increase in the market and a reversal takes place in the market due to which the particle stock starts rising.
How to trade with the Bullish Abandoned Baby candlestick pattern ?
Bullish abandoned baby candlestick pattern is quite easy to use in trading,
When this triple candle pattern is formed at the support, then we have to set the market entry, stop loss, and target as follows:-

1.Entry: – After the formation of this triple candlestick pattern, whichever of the next three candles breaks the high of the first candle, we should enter the market from there.
2.Stop Loss:- In this candlestick pattern, we should set the stop loss slightly below the low of the second candle.
3.Target:- After setting the entry stoploss in the market, we should set the target after looking at the resistance or we should set the target which is two or three times of our stoploss.
Instagram click here
https://www.instagram.com/smartstockadda?igsh=NmloZHgyMTBzcnoz
YouTube channel click here
https://youtube.com/@smartstockadda1?si=wQIeoYfvTebfjCiY
Facebook page click here https://www.facebook.com/profile.php?id=61558073196066&mibextid=ZbWKwL