bearish harami
What is BEARISH HARAMI CANDLESTICK PATTERN?
Bearish Harami Candlestick Pattern: This is a bearish candle stick pattern.
Which tells us that there is going to be a recession in the market. It is formed during an up trend.
The word Harami is derived from the Japanese language which means pregnant because its shape is like that of a pregnant candlestick.There are two types of candles in this, the first candle is bullish and the second candle is bearish.
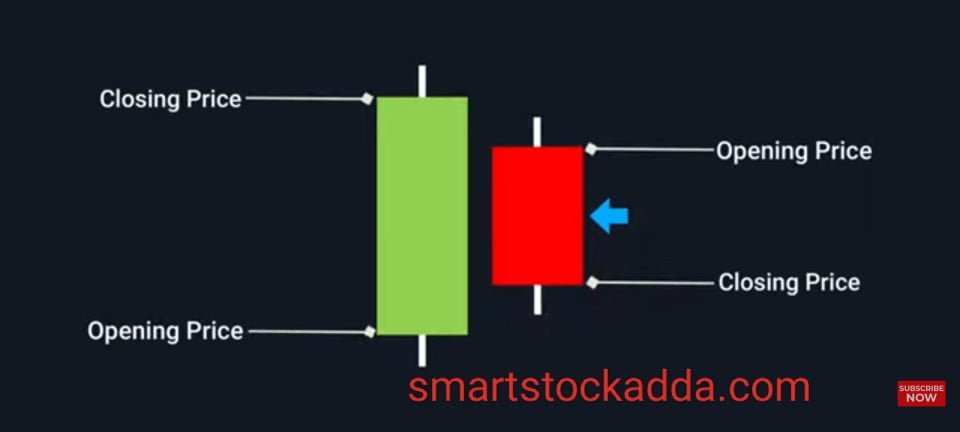
- first candle
- It is the one that tells us the speed, which is of big size and its color is green.
- second candle
- The second candle is a smaller bearish candle. It is red in color and its size is 50% or half of the first candle, which is covered by the first candle.
- The second candle is formed between the high and low of the first candle.
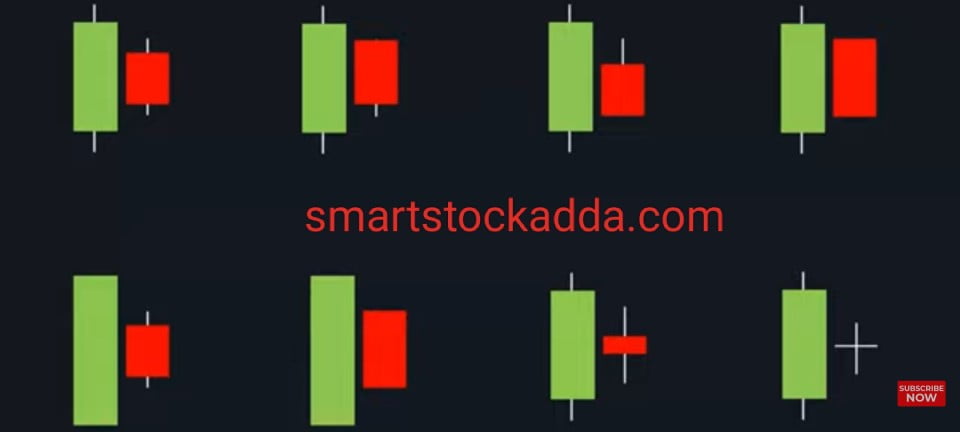
How can we see the BEARISH HARAMI CANDLESTICK PATTERN forming on the chart?
In the picture given below, we have explained in what ways the Bearish Harami Candlestick Pattern can be seen forming on the chart. These are its types: –
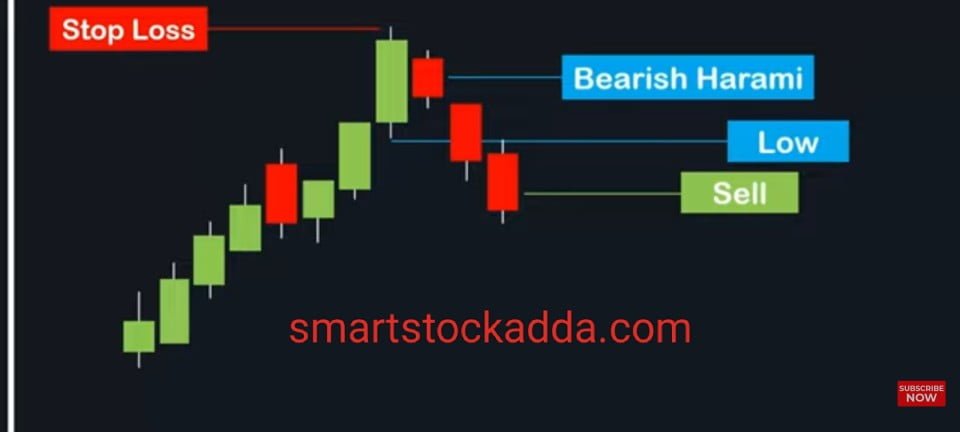
How to identify BEARISH HARAMI CANDLESTICK PATTERN ?
It is quite easy to identify it. When the market is on an uptrend, a big bullish candle is formed after reaching the resistance and after that a small bearish candle is formed, then it is a bearish Harami candlestick pattern. This is a sign that a recession is about to occur in the market, then we see this pattern.
ALL Single candle stick pattern in one pdf read know : https://smartstockadda.com/single-candlestick-pattern/
HOW TO TRADE WITH BEARISH HARAMI CANDLESTICK PATTERN
Trading with Bearish Harami Candlestick Pattern is very easy. I am very interested in how to enter the market with it, how to set stoploss and target.
BEARISH HARAMI CANDLESTICK PATTERN How to enter the market ?
After the formation of Bearish Harami Candlestick Pattern, the first candle which is a bullish candle, breaks its low and we have to take entry from whichever candle it does in the next three candles.
Whether after the formation of bearish Harami candles, the next candle can break the low of the first candle or it can break any one of the next three candles. If it is unable to break more than three candles, then we do not consider it a bearish attack. Then we don’t have to look at market entry.
Therefore, after the formation of Bearish Harami candlestick pattern, whichever low of the next three candles breaks below the first candle, I have to enter the market from there.
Open demet account angle one click here : https://angel-one.onelink.me/Wjgr/9v76ufmo with 15rs/order brokreage charges top 100 users limited offter
BEARISH HARAMI CANDLESTICK PATTERN How to set stoploss ?
It is very easy to set stoploss in Bearish Harami Candlestick Pattern. After taking entry in the market, we have to set stoploss at the high of the first bullish rising candle.
BEARISH HARAMI CANDLESTICK PATTERN How to set target?
It is very easy to set the target in Bearish Harami Candlestick Pattern. We can set the target by looking at the support or we can set the target by taking two or three times our stop loss.
Features and importance of BEARISH HARAMI CANDLESTICK PATTERN ?
- The second candle formed in it is small and a bearish trend candle.
- Bearish Harami Candlestick Pattern
- This double candlestick pattern gives a bearish message in the market.
- The first candle in this is a big and bullish green candle.
- Color is important in Bearish Harami Candlestick Pattern. In this, the first candle should be green and the second candle should be red.
- Bearish Harami Candlestick Pattern: The second candle formed in this should be 50% or less of the first candle and should be eclipsed by the first candle.
- Bearish Harami Candlestick Pattern: When this pattern is formed, it should be formed on resistance because even then there is a strong possibility that there may be a recession or decline in the market.
- In Bearish Harami Candlestick Pattern, we should also check the volume along with it because market or fall occurs only when the volume is high and the volume of the candles formed after this should also be increased.
- Bearish Harami Candlestick Pattern: Along with this, indicators should also be used because indicators provide confirmation that the trend is going to change in the market, the market is going to go from up trend to down trade.
- Important indicators to check confirmation are MACD and RSI.
Relationship between BEARISH HARAMI CANDLESTICK PATTERN and VOLUME ?
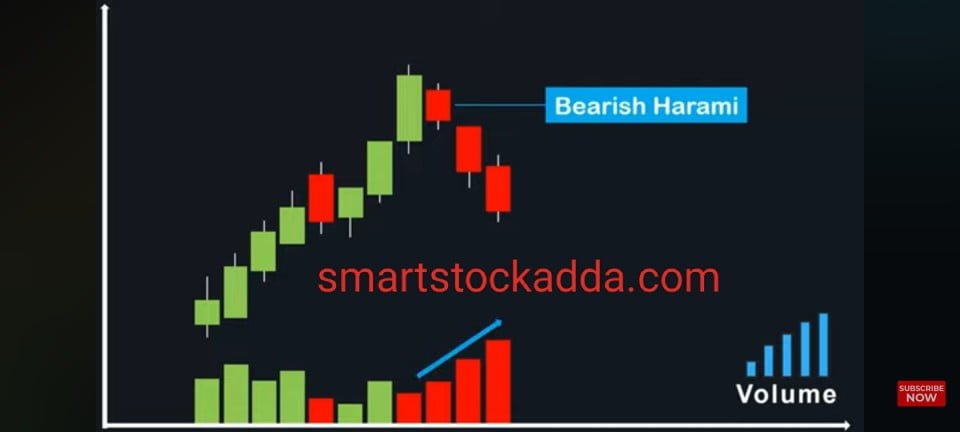
As you are told in the chart below, after the formation of the bearish Harami candle pattern, the volume also increased. Similarly, if we see this candlestick pattern being formed on the chart, then after this we also have to see the volume to see the next candles being formed. Is the volume in them high or not? If the volume is not high then it may not be a sign of recession.Because the market seems to be bullish here, hence if the volume is high then only there is a good trade opportunity in the market, and there is a good confirmation whether there can be a change in the market now, hence it is very important to check the volume.
Open demet account angle one click here : https://angel-one.onelink.me/Wjgr/9v76ufmo with 15rs/order brokreage charges top 100 users limited offter
RSI & MACD indicators with BEARISH HARAMI CANDLESTICK PATTERN ?
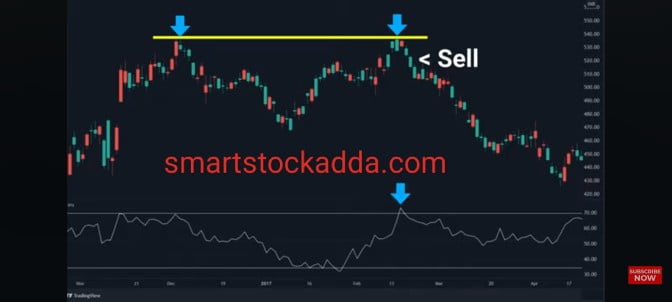
As you can see in the chart, the market went to the resistance and pulled back from there. We compressed it with the RSI indicator where the RSI indicator was showing 70 due to which we got confirmation that a bearish phase may start in the market after that. The market started falling.
Therefore, along with creating this candlestick pattern, it is necessary for us to also use indicators.
Instagram click here
https://www.instagram.com/smartstockadda?igsh=NmloZHgyMTBzcnoz
YouTube channel click here
https://youtube.com/@smartstockadda1?si=wQIeoYfvTebfjCiY
Facebook page click here https://www.facebook.com/profile.php?id=61558073196066&mibextid=ZbWKwL