bearish engulfing
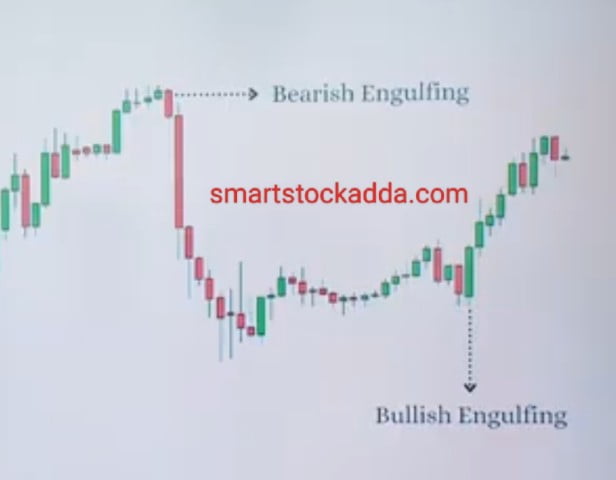
view on chart bearish engulfing :-

WHAT IS BEARISH ENGULFING CANDLESTICK PATTERN ?
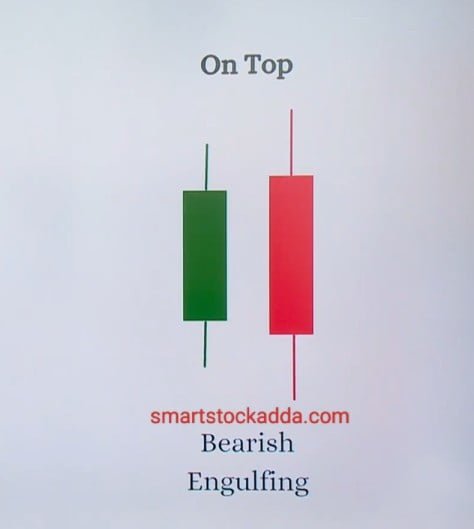
- This double candle stick pattern is formed in the up trend in the market, which indicates a downtrend in the market. By making changes in the market which is moving in an uptrend, it gives us a signal of decline. This is a bearish candlestick pattern.
- There are two candles in it, the first candle is green and the second candle is red.
- This candle stick pattern is formed on resistance. After the formation of this candle stick pattern, recession starts in the market.
ALL Single candle stick pattern in one pdf read know : https://smartstockadda.com/single-candlestick-pattern/
HOW TO IDENTIFY BEARISH ENGULFING CANDLESTICK PATTERN?
To identify Bearish Engulfing Candlestick Pattern, we have to keep some things in mind which are as follows:

- In this candlestick pattern, the first candle will always be green and the second candle will always be red.
- The first candle will be smaller than the second candle or it will be equal to the second candle.
- It will be seen forming at resistance.
- Keep in mind that if a candle stick pattern is formed in the middle of the chart or on the support, then it has no significance.
- We will see a candlestick pattern divided at resistance after the continuous rise in the market.
- After the formation of this candlestick pattern, the market falls.
- In this, the first candle which is green indicates a bullish trend in the market and the second candle which is red which indicates a recession or decline in the market.
Open demet account angle one click here : https://angel-one.onelink.me/Wjgr/9v76ufmo with 15rs/order brokreage charges top 100 users limited offter
USAGE OF BEARISH ENGULFING CANDLESTICK PATTERN IN TRADING ?

- A trader always wants to take a good trade so that he can make good profits and not suffer losses.
- Keeping these things in mind, we will tell you how to do entry, stop loss and target with this pattern.
ENTRY:-
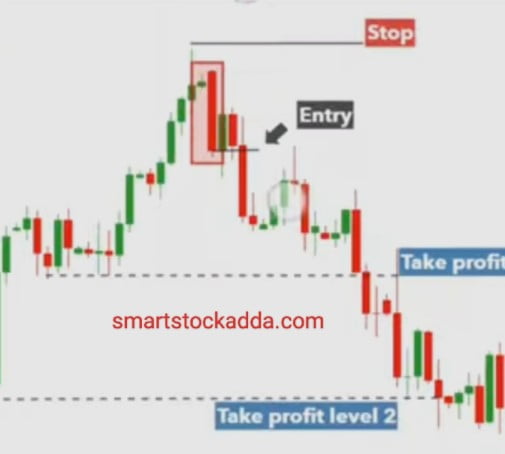
Bearish Engulfing Candlestick Pattern / Bearish Engulfing Candlestick Pattern When this pattern is formed at the resistance, then after the formation of this pattern, we have to wait for any one of the next three candles to break the low point of the second candle. When it breaks the low point of the second candle then we have to enter the market from there or it is the right time to enter.
STOPLOSS :-
It is quite easy to set stoploss in Bearish Engulfing Candlestick Pattern. In this, stoploss has to be placed a little above the high of the second big candle.
TARGET :-
In this, we set the target by looking at the support or our target should be two or three times of our stoploss.
Special features and importance of BEARISH ENGULFING CANDLESTICK PATTERN !
- After the formation of this candlestick pattern, a downward trend begins in the market.
- This candlestick pattern should always be formed at resistance only.
- In this, the first candle should be green and the second candle should be red.
- In this candlestick pattern, the first candle is equal to or smaller than the second candle.
- The first candle should not be bigger than the second candle.
- After the formation of this candlestick pattern, we should always look at the volume to confirm that the market is about to start a downward trend. This pattern is likely to be successful only when the volume is high.
- Along with this candlestick pattern, we should also use indicators like:- RSI & MACD
- This is a bearish candlestick pattern.
- Which indicates recession or decline in the market.
Information about candles in BEARISH ENGULFING CANDLESTICK PATTERN ?
As we know, this is double candlestick pattern, it has two candles, the first is green and the second is red.
Know these two candles closely
- The first candle in the market will be green and will be formed on the resistance, this means that the bullish phase will continue in the market and the candle will be small.
- After the formation of the first calendar, the second candle that will be formed will be a big bearish candle which will indicate that the buyers are becoming weak in the market and the sellers are now dominating the market due to which the market may now fall into recession.
- This means that sellers are dominating the market.
Keep in mind: – Keep in mind that the first candle will be smaller in size than the second candle.
And the bigger the second candle is, the greater will be the chances of reversal in the market.
RELATIONSHIP IN BEARISH ENGULFING CANDLESTICK PATTERN AND VOLUME ?
When this double candlestick pattern is formed at the resistance, the second candle is bigger than the first candle and together we will see the volume of both of them. Keep in mind that the volume of the second candle should be more than the first candle.
Along with that, the next candles formed after the formation of Bearish Engulfing Candlestick Pattern should also have higher volume i.e. if they are in increasing order then this reversal will be considered very strong.
Instagram click here
https://www.instagram.com/smartstockadda?igsh=NmloZHgyMTBzcnoz
YouTube channel click here
https://youtube.com/@smartstockadda1?si=wQIeoYfvTebfjCiY
Facebook page click here https://www.facebook.com/profile.php?id=61558073196066&mibextid=ZbWKwL

