TRADING STRATEGY DARK CLOUD CANDLESTICK
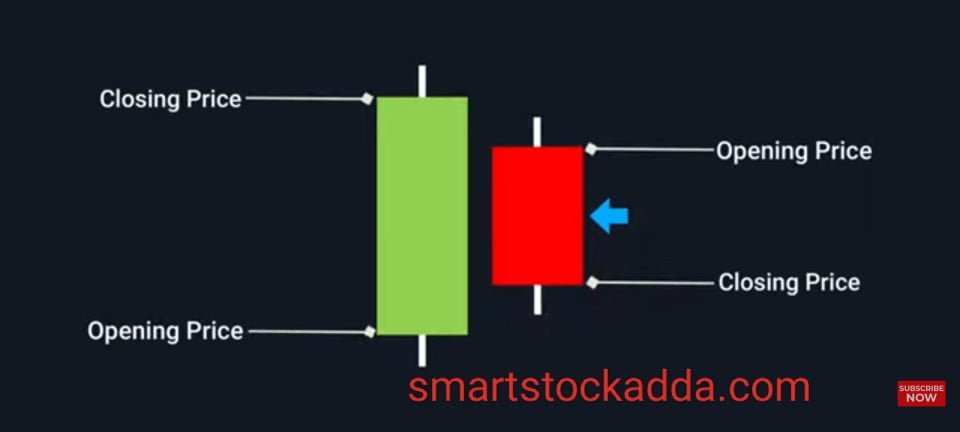
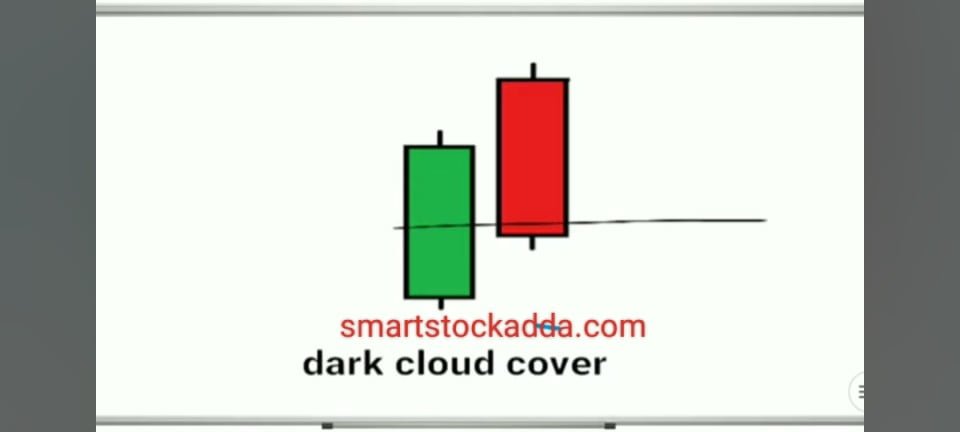
what is DARK CLOUD COVER CANDLESTICK PATTERN ? The dark cloud cover candlestick pattern is considered a reversal pattern which gives us signals of a down trend in the market. It falls under the category of double candlestick patterns in which the first candle is a large bullish candle while the second candle is a […]
TRADING STRATEGY DARK CLOUD CANDLESTICK Read More »
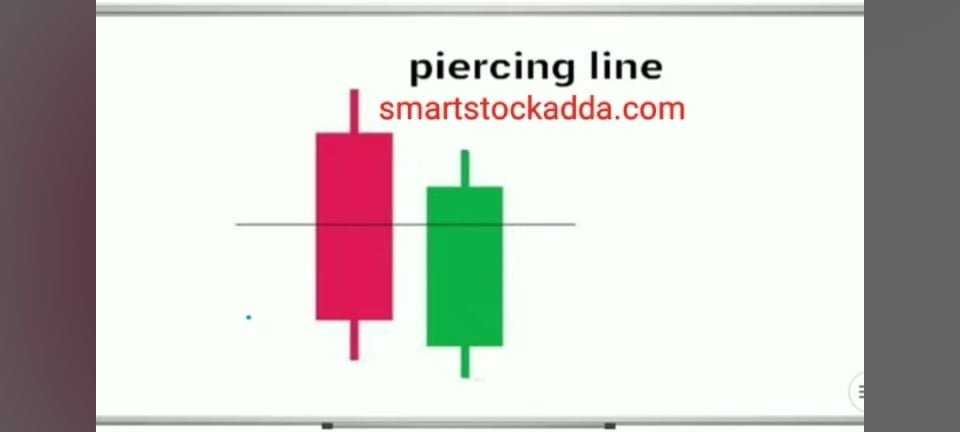
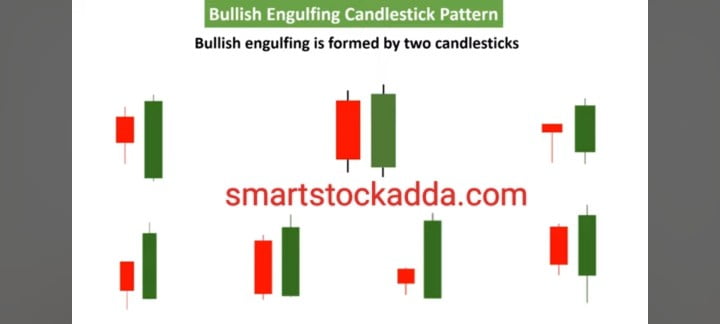
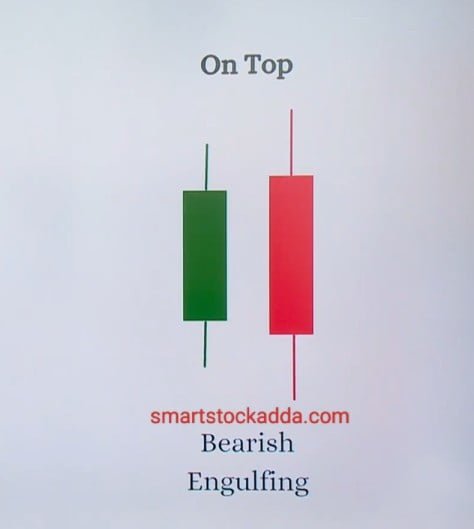
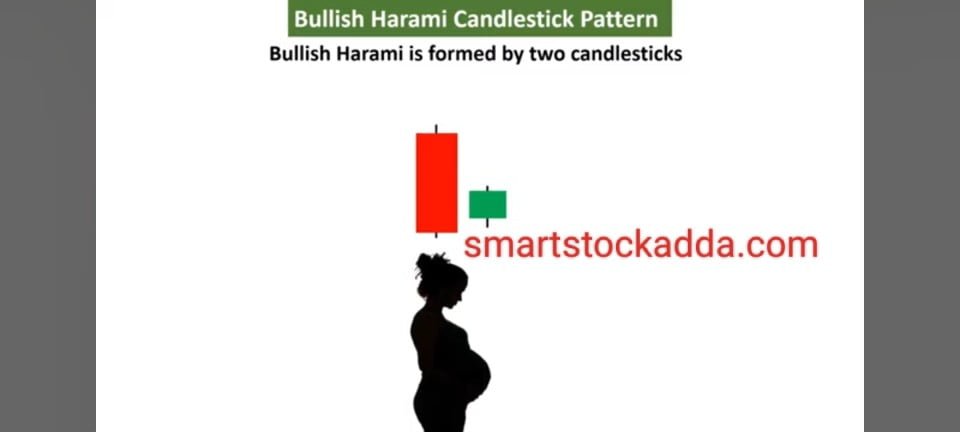
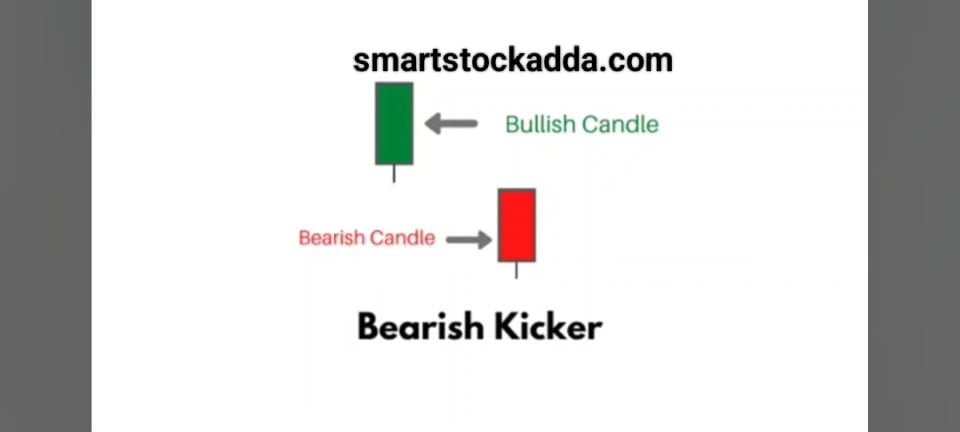
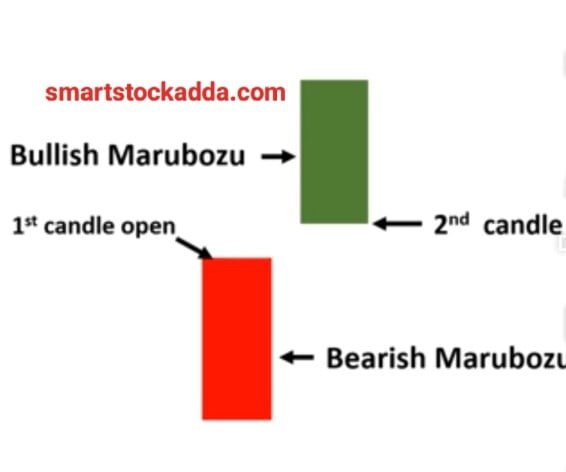
Candle stick Eg., Double candle stick