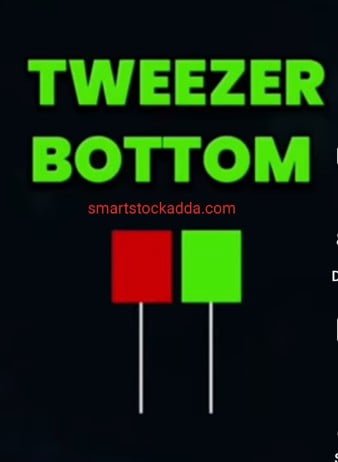
tweezer top
its view of tweezr top candle stick pattern

What is TWEEZER TOP CANDLESTICK PATTERN?
The Tweezer top candlestick pattern is a bearish candlestick pattern that forms at the end of a market uptrend. This shows recession in the market. After its formation, it is considered likely that there may be a recession or decline in the market.
This is considered a tweezer-like candle pattern.
Because this is a double candlestick pattern, it consists of two candles, the first candle is GREEN and the second candle is RED. The highs of both are equal or may be slightly higher or lower.
How to trade with TWEEZER TOP CANDLESTICK PATTERN?

To understand how we should trade with the Tweezer top candlestick pattern, we will focus on three things: first, to know in detail how to enter the market with this candlestick pattern, where to place the stoploss and how to set the target. Let’s try :-
ALL Single candle stick pattern in one pdf read know : https://smartstockadda.com/single-candlestick-pattern/
TWEEZER TOP CANDLESTICK PATTERN When to enter the market ?
After the Tweezer top candlestick pattern is formed, if the next candle formed after it is a bearish candle and its volume is high, then we need to time the candle when it breaks below the low of the second candle. It is correct to take entry in.
TWEEZER TOP CANDLESTICK PATTERN Where do I place STOPLOSE ?
Stop loss time should always be set slightly above its high point so that even if it is retested, the chances of hitting the stop loss are greatly reduced.
What and where to set the target in Tweezer Top Candlestick Pattern?
Since this candlestick pattern is formed at the resistance top, we should set the target after looking at the support or we should always set the target two or three times of our stop loss.
Open demet account angle one click here : https://angel-one.onelink.me/Wjgr/9v76ufmo with 15rs/order brokreage charges top 100 users limited offter
Reason for formation of TWEEZER TOP CANDLESTICK PATTERN ?
The main reason for the formation of this candlestick pattern is that when the market keeps rising continuously, it reaches its final stage. After reaching the final stage, the sellers try to bring down the price and the market. Bearish phase starts in 2018, this is the main reason for formation of Tweezer top candlestick pattern.
HOW TO IDENTIFY TWEEZER TOP CANDLESTICK PATTERN?
- This candlestick pattern is formed during periods of sustained market uptrend.
- We see this at resistance during bullish times.
- In this, the color of the first candle is HOTA, it should be green which indicates a bullish trend in the market.
- The other candles may be red or green.
- In a candlestick pattern, the high or highest price of the first and second candles is the same or may be slightly higher or lower.
- The first candle is Bullish and it can be any one of the bullish patterns like short body or long body but it indicates active buying.
- The higher the volume of the second candle formed, the greater are the chances of a reversal.
- The Tweezer top candlestick pattern indicates the possibility of a bearish or down trade.
- If formed during an uptrend, it indicates the possibility and indication of a reversal against the uptrend.
- Keep in mind that whatever be the candlestick pattern, we should use additional technical analysis tools such as indicators (RSI & MACD), volume etc.
RELATIONSHIP BETWEEN TWEEZER TOP CANDLESTICK PATTERN AND VOLUME ?
In any kind of candlestick pattern, the importance of volume becomes very high because if the volume is high then there are chances of reversal, hence when the candlestick pattern is formed in this candlestick pattern, then the volume of the second candle in it should be more. Also, whatever candles are formed after this, there are chances of reversal only if their initial volume is high. If the volume is not high, a fake reversal pattern can also be formed.
Open demet account angle one click here : https://angel-one.onelink.me/Wjgr/9v76ufmo with 15rs/order brokreage charges top 100 users limited offter
What should be the color of the candles in TWEEZER TOP CANDLESTICK PATTERN?
- In this candlestick pattern the color of the first candle is important
- In this, the first candle formed is formed during the bullish period, so it should be a bullish candle. In the companion, it can be any one of the bullish candles which should be green in colour.
- In this, the color of the second candle is not important, we just have to keep in mind that the high of the second candle should be equal to the high of the first candle, only then it is considered a strong candlestick pattern.
What should be the LOW PRICE of TWEEZER TOP CANDLESTICK PATTERN ?
This is worth knowing because in this pattern all the work is done by the price. This pattern works when the price is the same.
The important thing in this is that the high of the first candle and the second candle should be the same or almost the same.
To understand this, let us take you through an example: –
Suppose a stock was in a bullish trend, it formed a resistance candle and the high of that candle was 90.
Now the high of the second candle that is formed after this is 90 or 89 91. In this situation, the highs of both the first candle and the second candle were almost the same, so this is a message that this is a tweezers top candlestick pattern.
Instagram click here
https://www.instagram.com/smartstockadda?igsh=NmloZHgyMTBzcnoz
YouTube channel click here
https://youtube.com/@smartstockadda1?si=wQIeoYfvTebfjCiY
Facebook page click here https://www.facebook.com/profile.php?id=61558073196066&mibextid=ZbWKwL
