bullish harami

What is HARAMI BULLISH candlestick pattern?
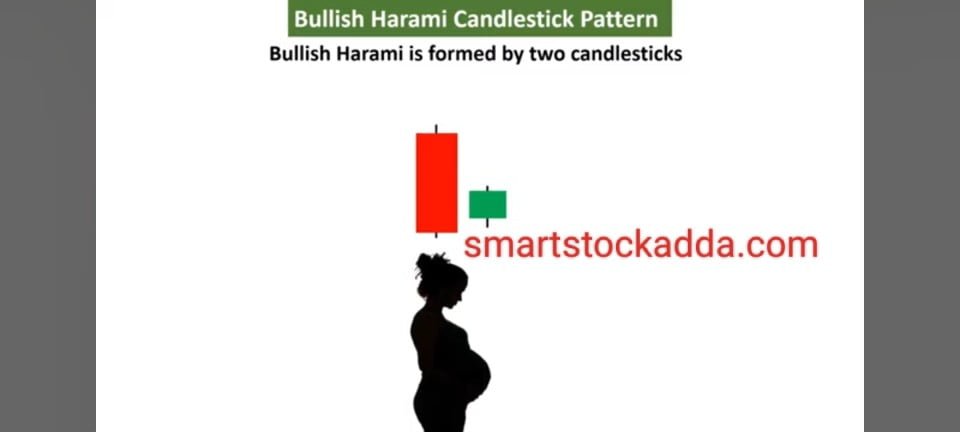
- The word Harami in the Harami bullish pattern is taken from the Japanese language which means pregnant.
- This is a double candlestick chart pattern in which we see two candles forming simultaneously, on the basis of which we predict that there may be a reversal in the market.
- Harami bullish candlestick
Two candles look like pregnant, hence we call it Harami candle pattern. - This shows a reversal in the market which gives us a bullish signal.
- When the Harami candlestick pattern is formed, it indicates the possibility of the market going bullish or upside down.
- When the market moves towards recession, we see a large bearish candle being formed at the bearish support, after which a small bullish candle is formed which can be 50% or slightly larger than the bearish candle and here The larger bearish candle covers the bullish candle.
USAGE OF HARAMI BULLISH CANDLESTICK PATTERN IN TRADING ?
Harami Bullish Candlestick Pattern: It is quite easy to use it in trading as you can look at the chart, from this we will understand closely how to enter the market, set stop loss and target.

How to enter the market in Harami bullish candlestick pattern ?
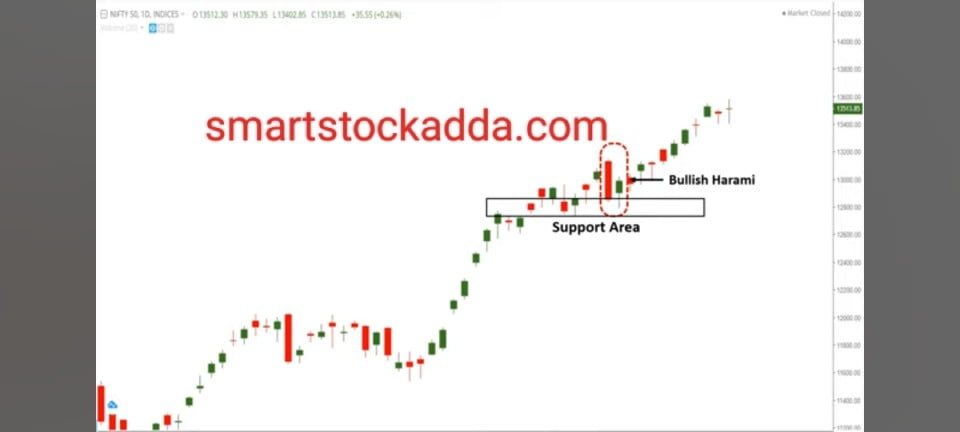
It is very easy to enter the market in this, as if you look at the chart, you will know that a Harami Bullish Candlestick pattern has been formed on the support. Immediately after this, three candles have been formed, then one of the three candles is in the negative.
The high of the bearish candle has been broken and then entry has to be taken in the market.Sometimes, immediately after the Harami Bullish Candlestick pattern is formed, there is the next candle that can break the high of the big bearish candle, then we should take entry from there also, but if it is more than three candles, then We do not want to enter the market again.
you can open your Demat account in our favorite broker ANGLE ONE LTD. can do :-
For this click on the link given below
Link :– https://angel-one.onelink.me/Wjgr/3x0hl7x1
HARAMI BULLISH CANDLESTICK PATTERN Where to place stoploss ?
In the Harami Bullish Candlestick pattern, we have to set stoploss on the red big candle, that is, we always have to set the point low on the minimum point of the red candle in the Harami Bullish Candlestick pattern. Should we place it like this or should we move a little below it with sl.
Where to set targets in Harami bullish candlestick pattern ?
It is very easy to set the target, we can set the target by looking at the resistance or we can set the target by two or three times our stop loss.
How is HARAMI BULLISH CANDLESTICK PATTERN formed on the chart?

Through this picture, we have tried to tell you that when there is a recession in the market, we can see the formation of Harami Bullish Candlestick Pattern at the support, which will indicate that the market is now bullish. Can.
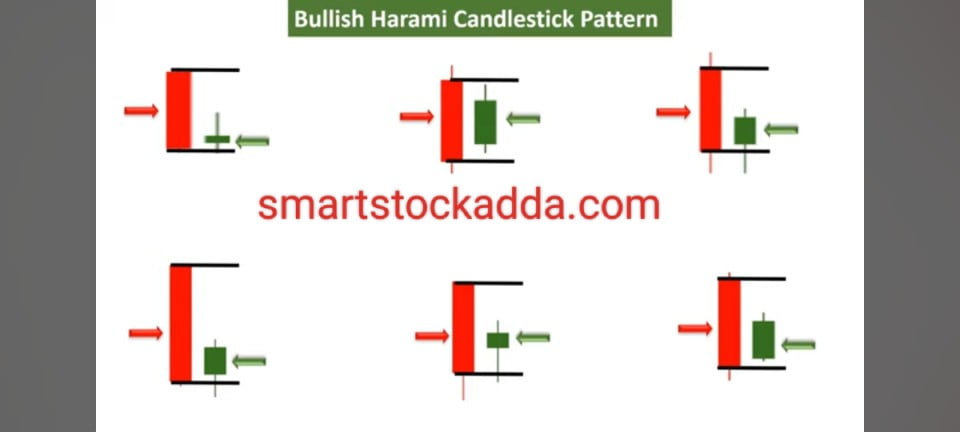
We have tried to explain to you through these 6 pictures that you can see Bullish Harami candles being formed in this manner in the market.
Important points and features of HARAMI BULLISH CANDLESTICK PATTERN?
- At the time of recession, we will see it forming on support in the downtrend, which indicates that a reversal is about to happen, now the market may rise.
- The Harami Police Candy Stick pattern gives us market reversal signals which indicate an up trend.
- Remember, when the market is in recession, we see a big bearish candle being formed on the support in the market and immediately after its closing, a small bullish candle is formed which can be half or 50% of the bearish candle and this The bullish candle is followed by the first bearish candle.
- The first big bearish candle is red in color and the bullish candle that is formed immediately after that is green in color.
- In this, the first bearish candle reflects the declining sentiment in the market, it tells us about the dominance of sellers.
- The body of the second candle is small and its entire body is covered by the first bearish candle, which reveals the feeling of indecision in the market.
- Generally, after the formation of Harami Bullish candles, if a third candle rises above the high of the second candle, then there is a strong possibility of an uptrend in the market.
How to know if market will rise in Harami bullish candlestick pattern?
After the Harami Bullish Candlestick pattern is formed, if we see a bullish candle emerging above the high of the first bearish candle, then we get confirmation that the market may rise. This candle is a bullish candle. The next candle can be any one of the three candles formed.
Keep in mind that after the Harami Bullish Candlestick pattern is formed, if none of the next three candles break the high of the first red candle, then it is not a bullish sign in the market.
HARAMI BULLISH CANDLESTICK PATTERN VOLUME AND RSI AND MACD INDICATOR ?
To confirm the reversal signal in Harami Bullish Candlestick pattern, you need to know the RSI indicator and MACD indicator to look at the volume.
After the formation of the Harami candle stick pattern, the possibility of a reversal is expressed only when its volume is high.Because reversal signals are correct only when its volume is high and MACD and RSI indicators are giving their signals for reversal in the market, hence it is very important for us to have knowledge of MACD and RSI indicators and volume in Harami Bullish Candle Stick Pattern.
“HARAMI BULLISH CANDLESTICK PATTERN” is worth paying attention to ?

Keep in mind that support is always formed because if it is formed on support then the chances of reversal are very high. If it is not formed on support then it has no meaning, hence we always see it being formed on support, only then the chances of market rise are high. Is.
After forming on the support, the next 3 candles that are formed i.e. when a big bearish candle is followed by a small bullish candle, the next three candles that are formed after that should break the high of the bearish candle. This is a sign of train reversal. Is.
Reason for formation of Harami Bullish Candlestick pattern ?
The market is going in a bearish trend and if it goes to the support and forms a big bearish candle then it means that the sellers want to take the market down but immediately after that a small bullish candle is formed. That is, such a candle which is smaller than the big bearish candle can be 50% or half of its value. In this situation, to prevent the sellers from dominating, buyers start looking for buying opportunities here, due to which a bullish candle is formed here. is constructed and this tells us that buyers are now going to come into the market.
That means whatever stock was there has fallen down till its last train line or is now ready to go up. Now there is going to be a trend change in the particular stock in the market.
F&O
HARAMI BULLISH CANDLESTICK PATTERN What is the color of the candle?
In this, the first candle is red in color and the second candle is green in color.
What does the HARAMI BULLISH CANDLESTICK PATTERN tell about the market?
This indicates an uptrend in the market and gives us a signal to enter a bullish site up trend in the market.
When is Harami Bullish Candlestick pattern formed?
Harami Bullish Candlestick pattern is formed in the market only when the market is in recession for a long time or it can be formed after reaching the support due to which there is a possibility of the market going into an up trend.
WHICH INDICATORS SHOULD WE USE WITH HARAMI BULLISH CANDLESTICK PATTERN?
With the Harami Bullish Candlestick pattern we should use the MACD RSI and volume indicators.
Instagram click here
https://www.instagram.com/smartstockadda?igsh=NmloZHgyMTBzcnoz
YouTube channel click here
https://youtube.com/@smartstockadda1?si=wQIeoYfvTebfjCiY
Facebook page click here https://www.facebook.com/profile.php?id=61558073196066&mibextid=ZbWKwL

