What is Bullish Kicker Candlestick Pattern?

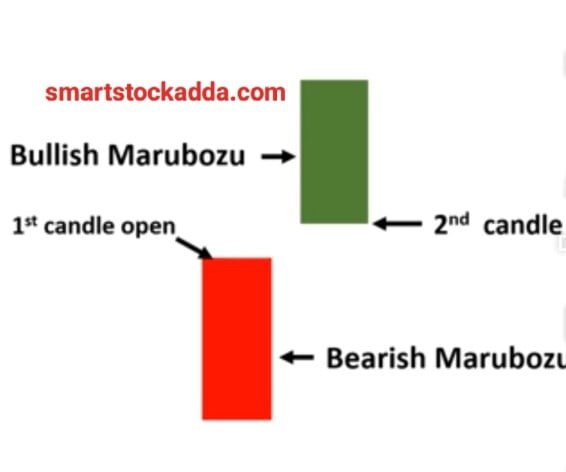
Bullish Kickar Candlestick Pattern is a candlestick pattern indicating the uptrend in the market which we see forming on the support. It consists of two candles, the first candle is a bearish candle and the second candle is a bullish candle. And this candle looks like a Maro Boju candle.
ALL Single candle stick pattern in one pdf read know : https://smartstockadda.com/single-candlestick-pattern/
HOW TO IDENTIFY BULLISH KICKER CANDLESTICK PATTERN ?
First of all, we have to keep in mind that this pattern should be formed when the market is on support, only then there are signs of change in the market i.e. bullishness, hence first it should be formed on support and in this we will see a big Maruboju like candle which is The second candle will represent a bearish one, immediately followed by a bullish candle which will open above the closing point of the first candle.
- Keep in mind that there must be a gap between the first bearish candle and the second bullish candle.
- The gap up from the first candle to the second candle opens.
- And if this pattern is formed at the time of uptrend by supporting per na ban, then it indicates that the market will continue to be bullish in future also.
Importance of Bullish Kicker Candlestick Pattern Features and Key Points ?
It is always formed during down trend or recession.
- The first candle should be red and the second candle should be green.
- The second candle should open above the closing point of the first candle.
- This double candlestick pattern should always be formed on support.
- The formation of this candlestick pattern is a bullish signal in the market.
- After this candlestick is formed, we should trade only after checking the volume in the market.
- With this candlestick pattern we need to use indicators such as MACD RSI.
- In this stop loss, we should set point low on the first red candle.
you can open your Demat account in our favorite broker ANGLE ONE LTD. can do :-
For this click on the link given below
Link :– https://angel-one.onelink.me/Wjgr/3x0hl7x1
How many candles does the Bullish Kicker candlestick pattern consist of ?
Bullish Kicker Candlestick Pattern always consists of two candles in which one candle is red and one candle is green.
What message does the Bullish Kicker Candlestick Pattern give us in the market?
This gives a message to the market that the market is going to rise.
Where might we see a Bullish Kicker candlestick pattern forming on the chart?
Bullish Kicker candlestick pattern can be seen forming on the chart as support during bearish times or if it is seen forming in the middle of the chart during bullish times, then it means that the market will remain bullish from now on.
Does color matter in the Bullish Kicker candlestick pattern?
Color is important in Bullish Kicker candlestick pattern, the first candle should be red and the second candle should be green, only then it is called Bullish Kicker pattern.
How to use the Bullish Kicker candlestick pattern in trading ?
Bullish Kicker Candlestick Pattern: Because it is a bullish candlestick pattern, there is a high probability of the market going bullish, so in this we will know where to enter the market, how to set stop loss and target, let us try to know them in detail. We do.

How to enter the market using the Bullish Kicker candlestick pattern ?
If the next candle after the Bullish Kicker candlestick pattern is formed in support, it becomes a bullish candle, then we have to take our market entry near that candle.
Bullish Kicker Candlestick Pattern Where to Place Stoploss ?
Bullish Kicker Candlestick Pattern: It is very easy to set stop loss in this. In this, we have to put sl on the low point of the first candle which is a red candle which is bearish.
Where to set targets in bullish kicker candlestick pattern ?
In bullish kicker candlestick pattern, we should always set our target after looking at the resistance or we should always set our target at two or three times the stop loss.
Instagram click here
https://www.instagram.com/smartstockadda?igsh=NmloZHgyMTBzcnoz
YouTube channel click here
https://youtube.com/@smartstockadda1?si=wQIeoYfvTebfjCiY
Facebook page click here https://www.facebook.com/profile.php?id=61558073196066&mibextid=ZbWKwL

